
Free to start · No watermark
AI Scientific Figure Generator
Describe a mechanism, workflow or study, or upload a sketch. Get a publication-ready scientific figure for your research paper in under two minutes, every label spelled right.
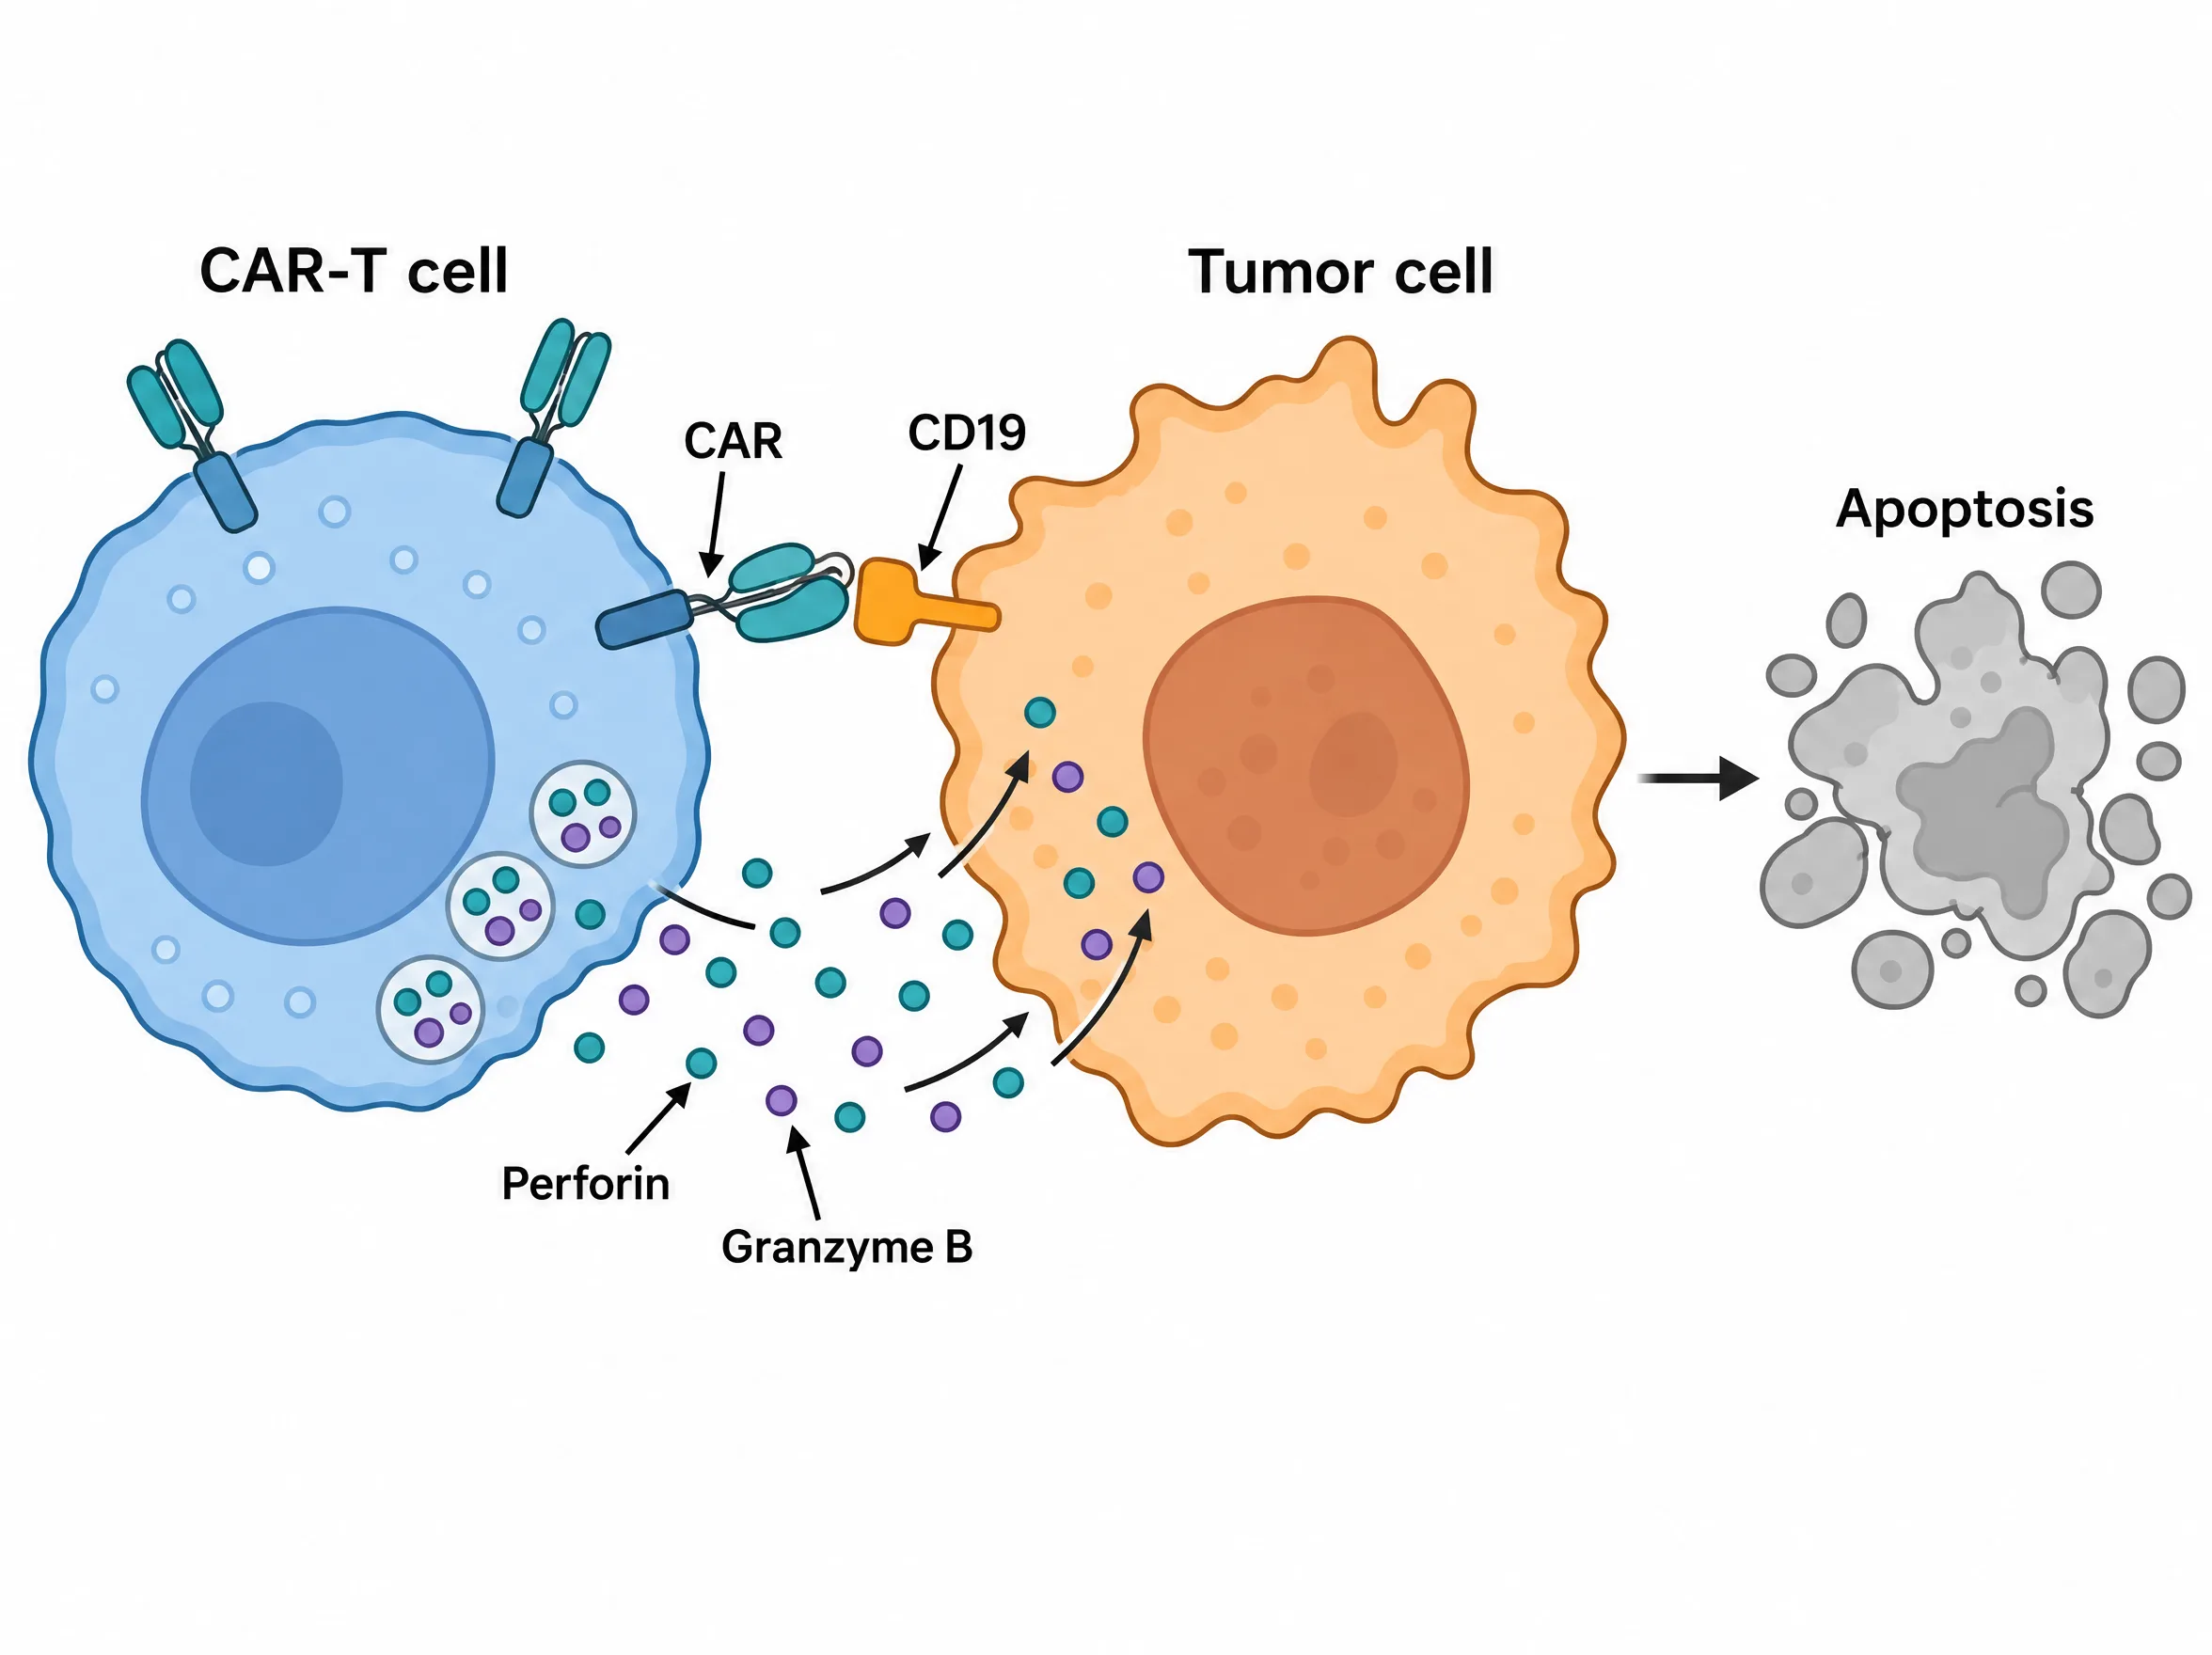
Made from one description
- 1 credit ≈ $0.20
- 2K PNG, 300 DPI
- Never used for training
Examples
AI scientific figure generator examples from six fields
Every figure here came out of the AI scientific figure generator in one pass, from the description printed under it. Use these scientific figure examples as a starting point: load one and change it to fit your study.
- A
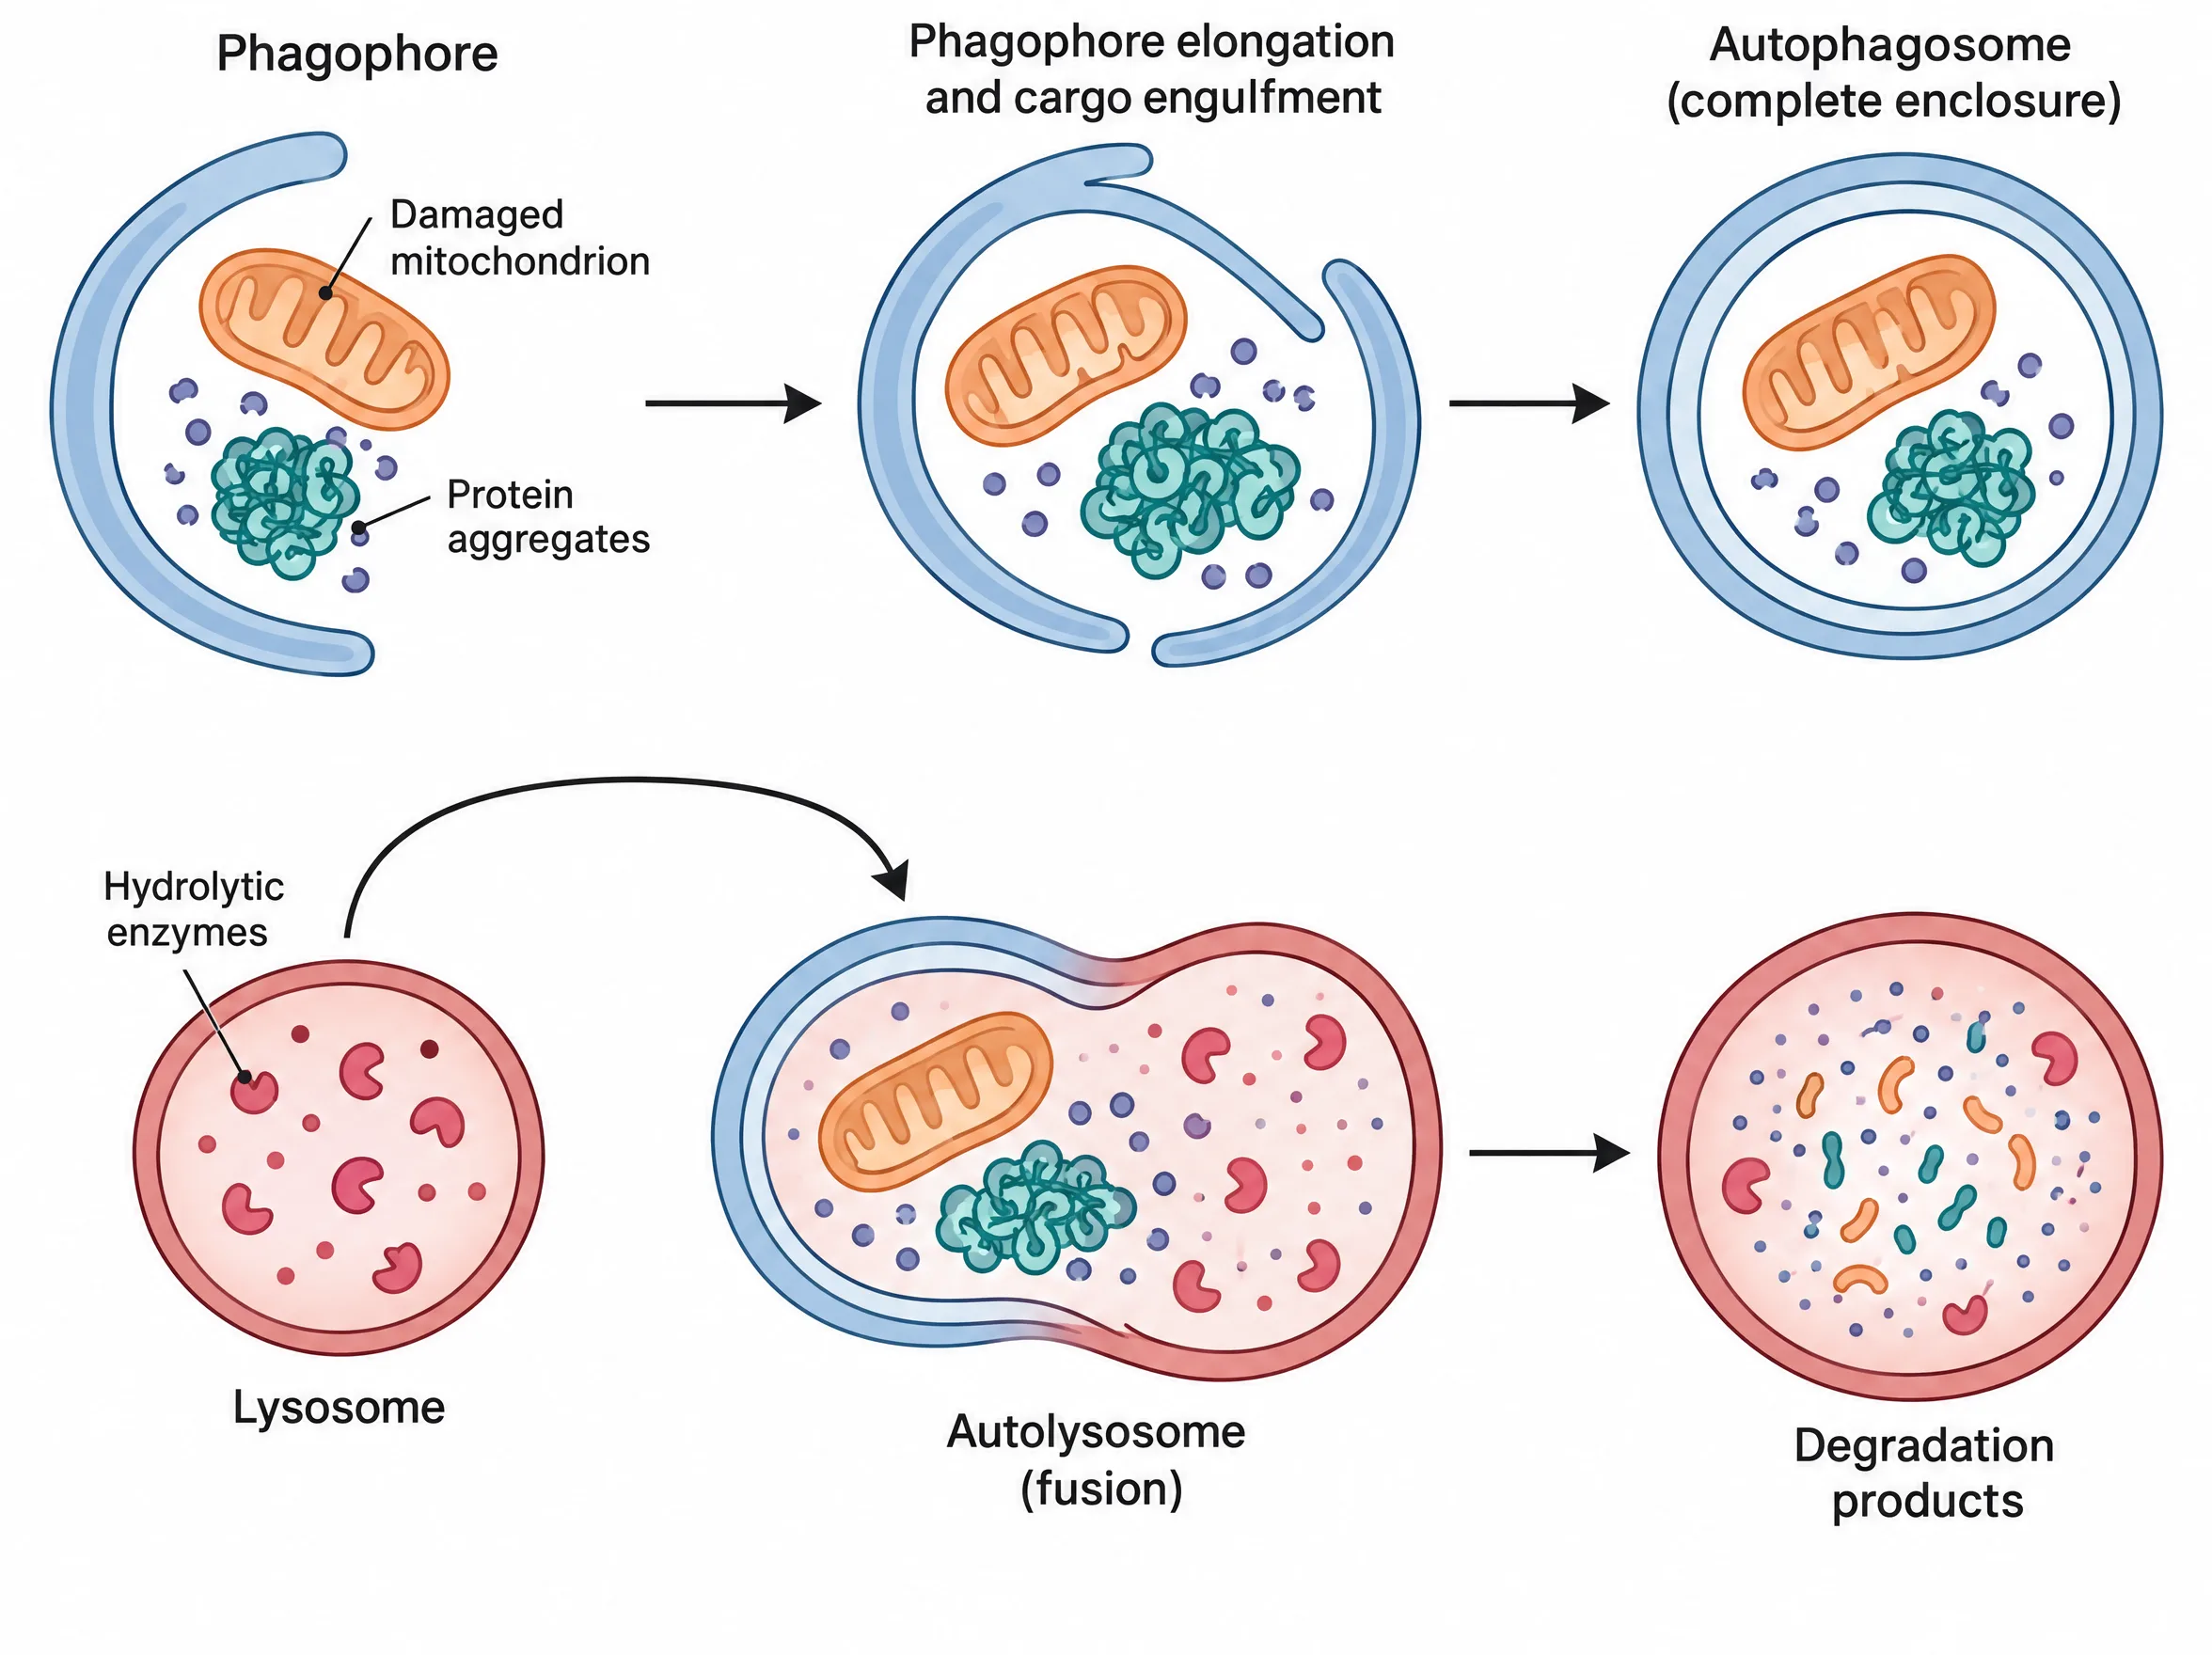
Cell biology · Mechanism
“Autophagy: a phagophore forms and engulfs a damaged mitochondrion and protein aggregates, closes into an autophagosome, fuses with a lysosome into an autolysosome, and the contents are degraded. Label each stage.”
- B
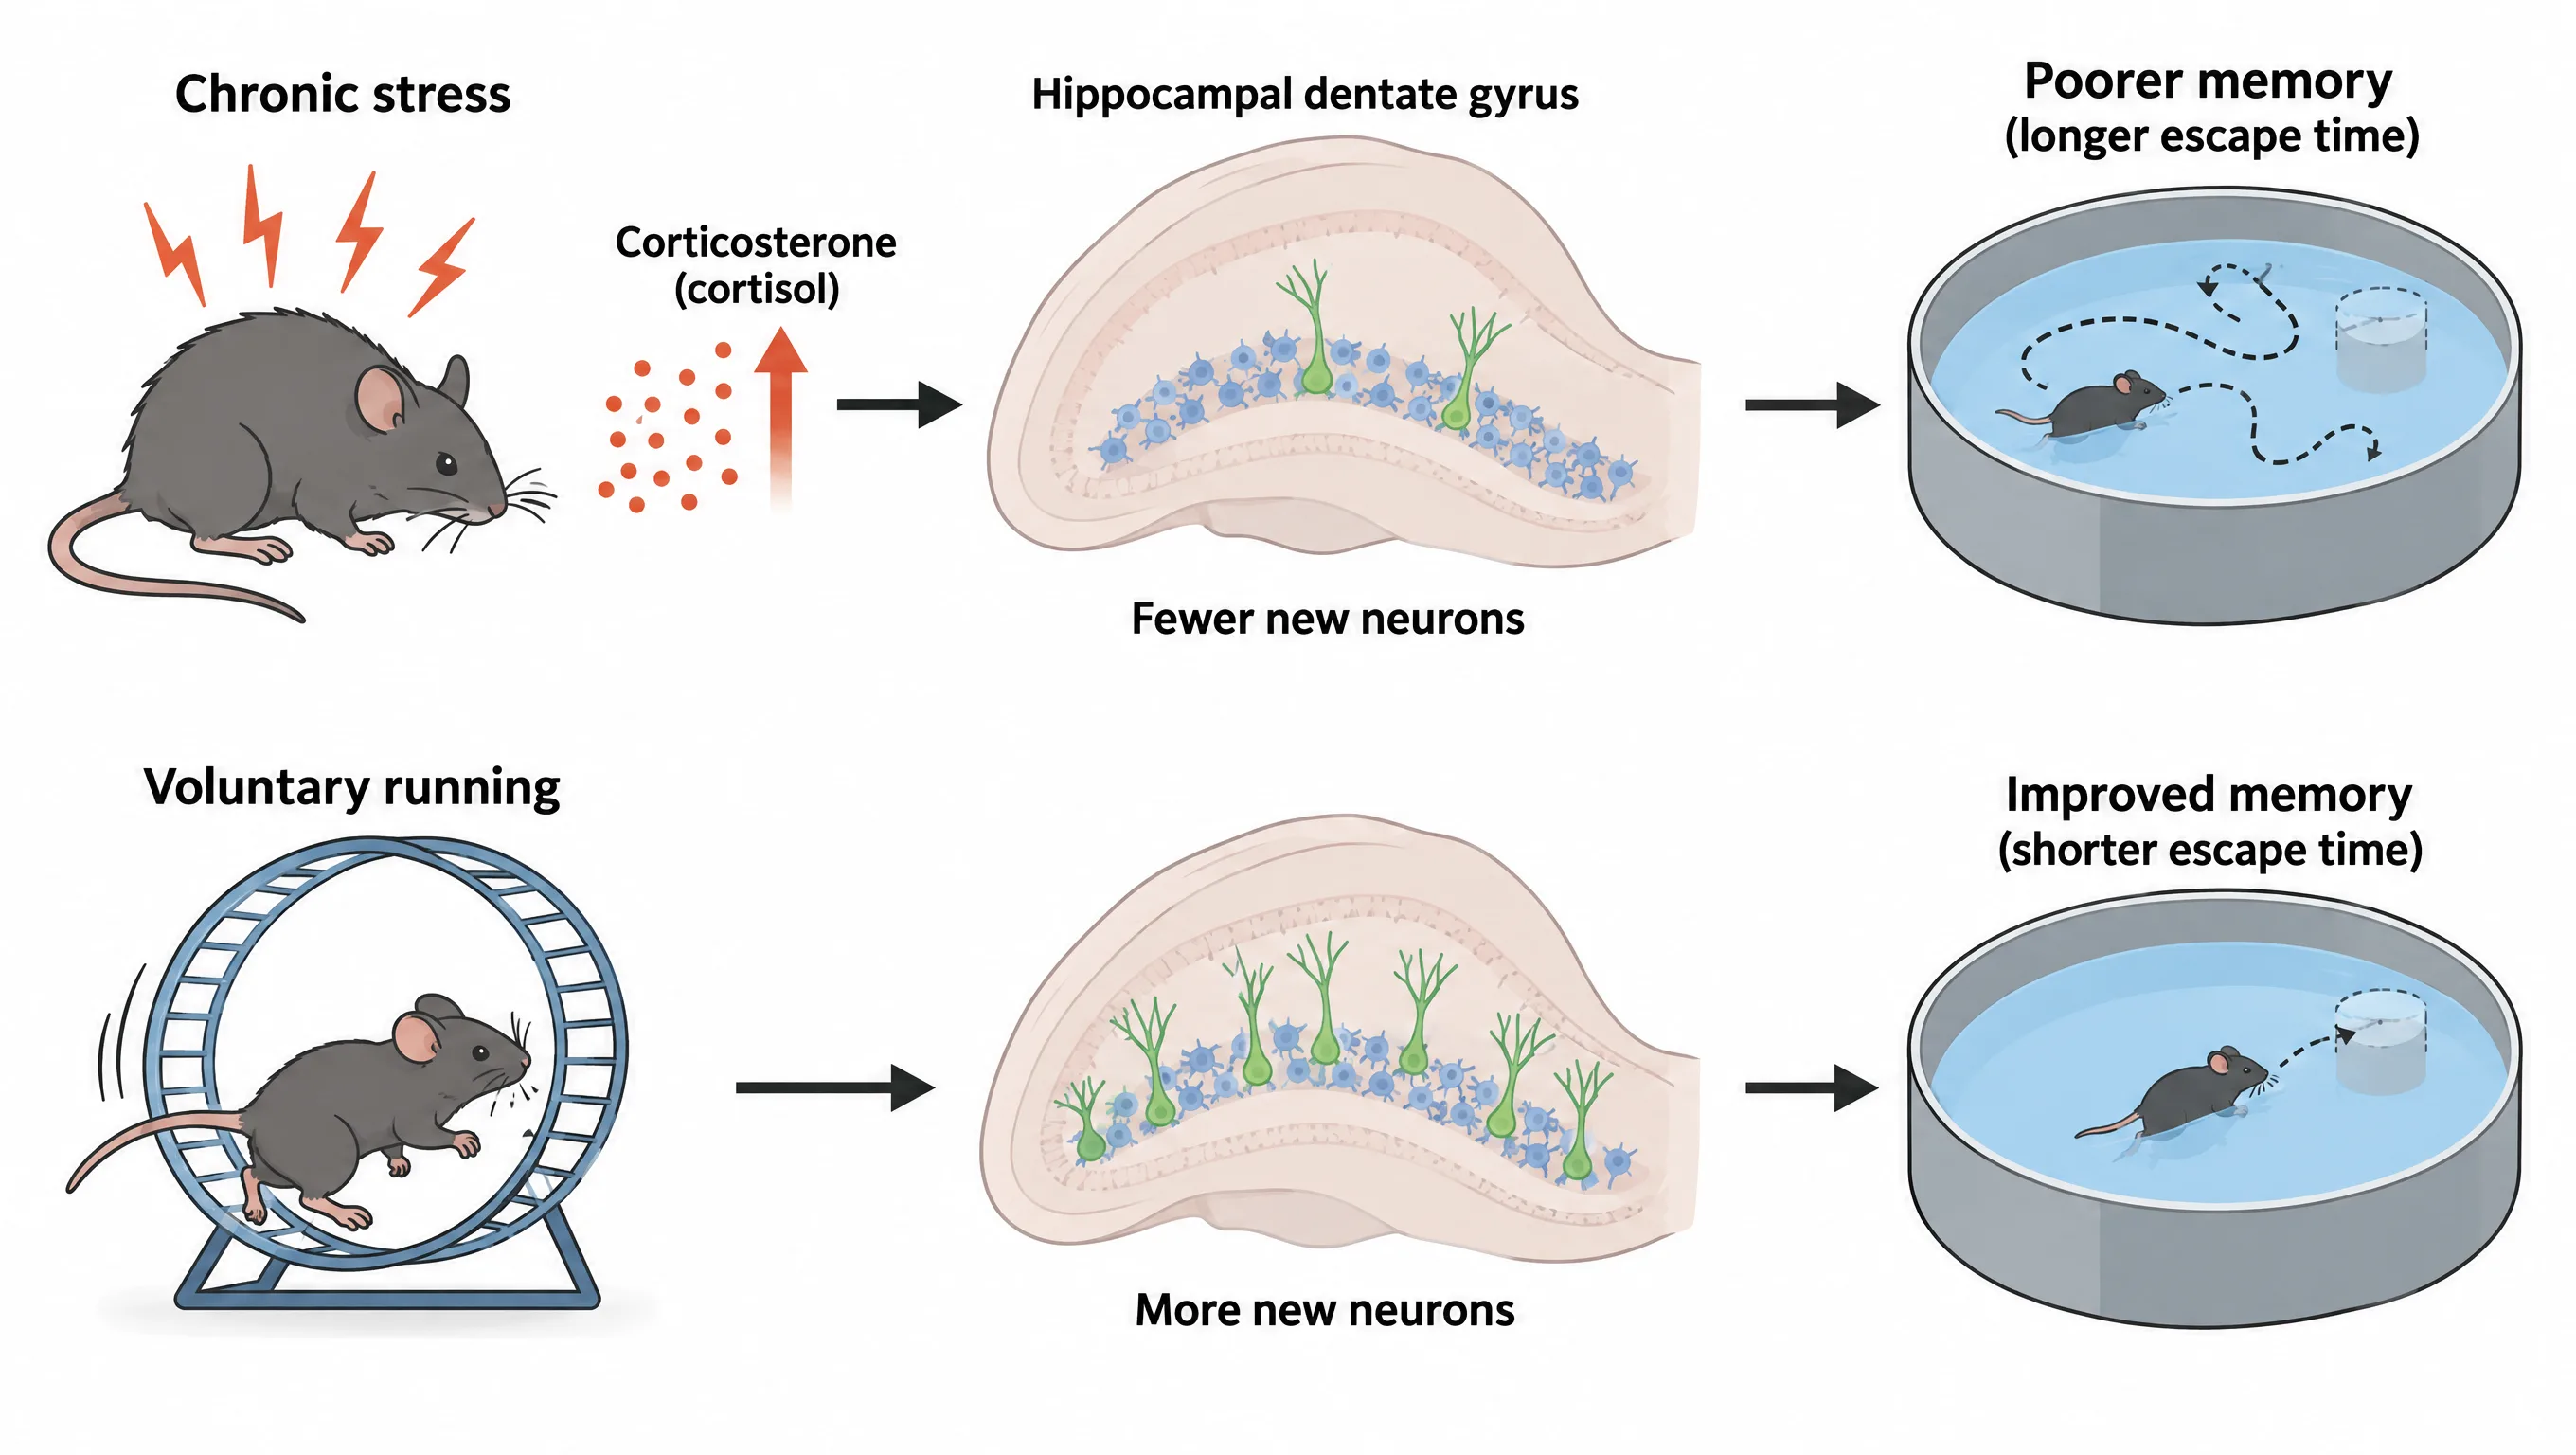
Neuroscience · Graphical abstract
“Chronic stress reduces hippocampal neurogenesis in mice. Left: a stressed mouse and rising cortisol. Middle: the dentate gyrus of the hippocampus with fewer new neurons. Right: poorer memory in a water maze test. Bottom: voluntary running on a wheel restores new neurons and memory.”
- C
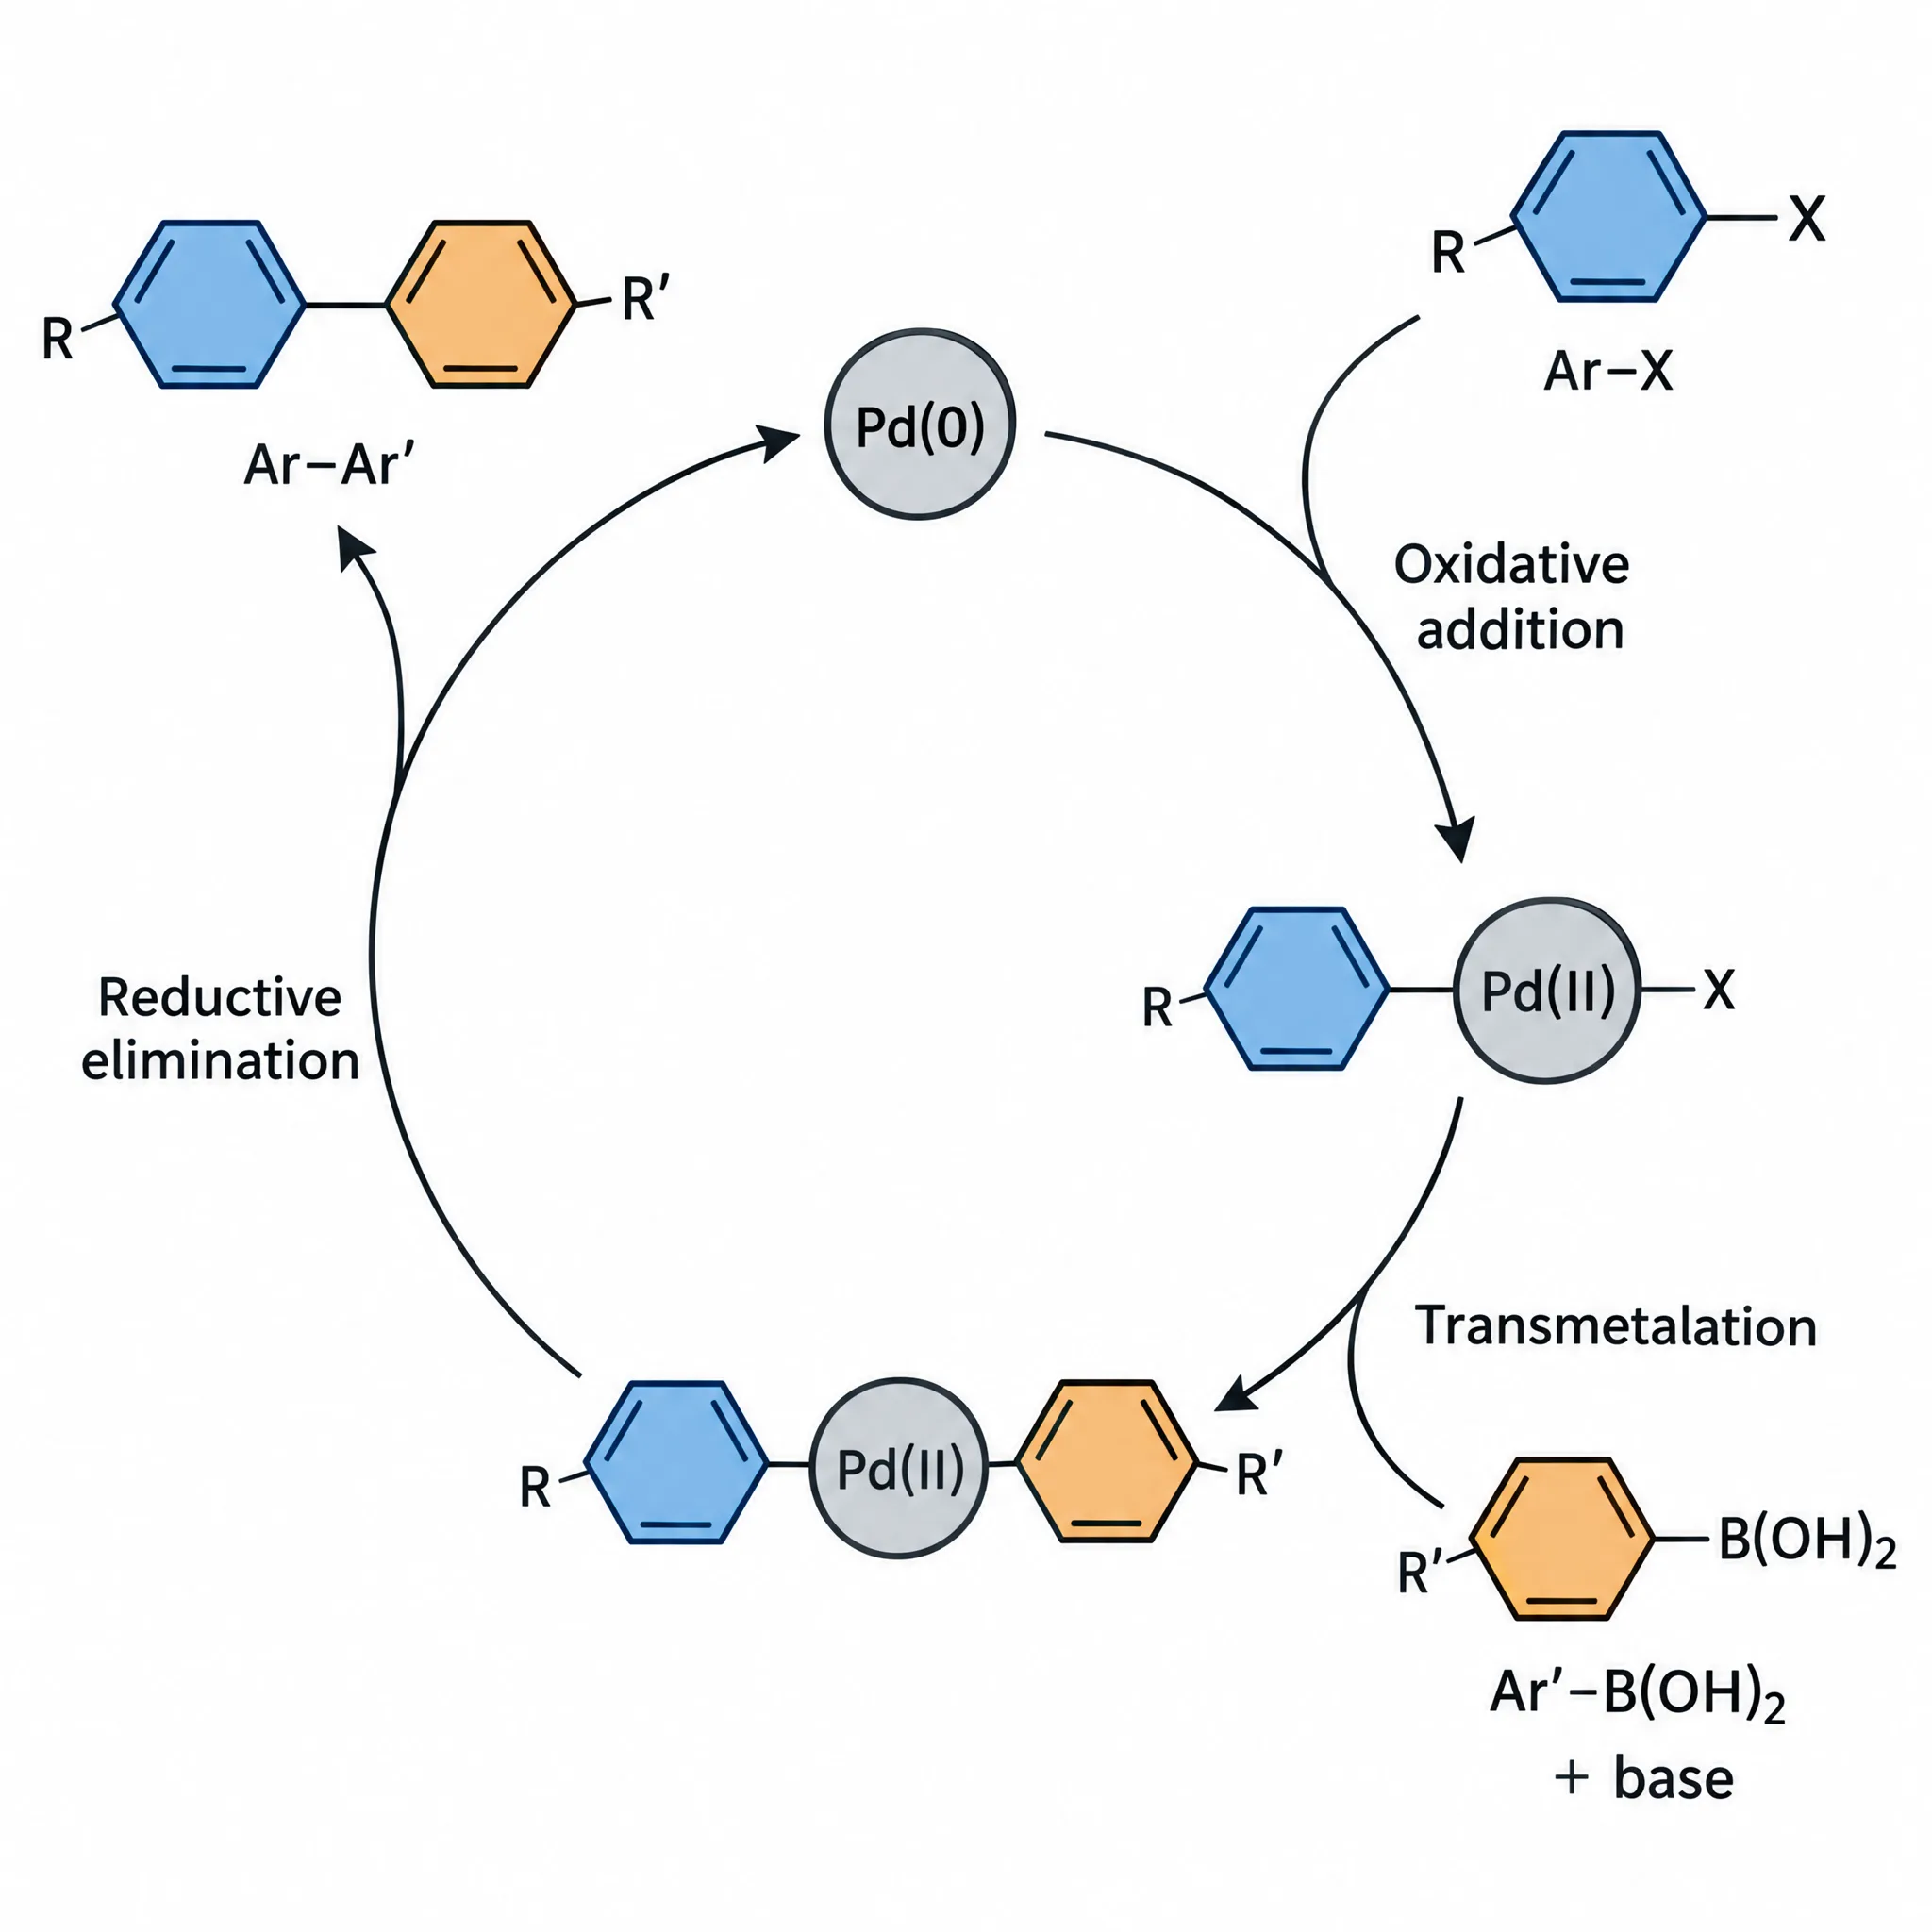
Chemistry · Illustration
“Catalytic cycle of the Suzuki cross-coupling reaction drawn as a circle: Pd(0) catalyst, oxidative addition of an aryl halide (Ar-X), transmetalation with an aryl boronic acid (Ar'-B(OH)2) and base, reductive elimination releasing the biaryl product Ar-Ar'. Label each step on the arrows.”
- D
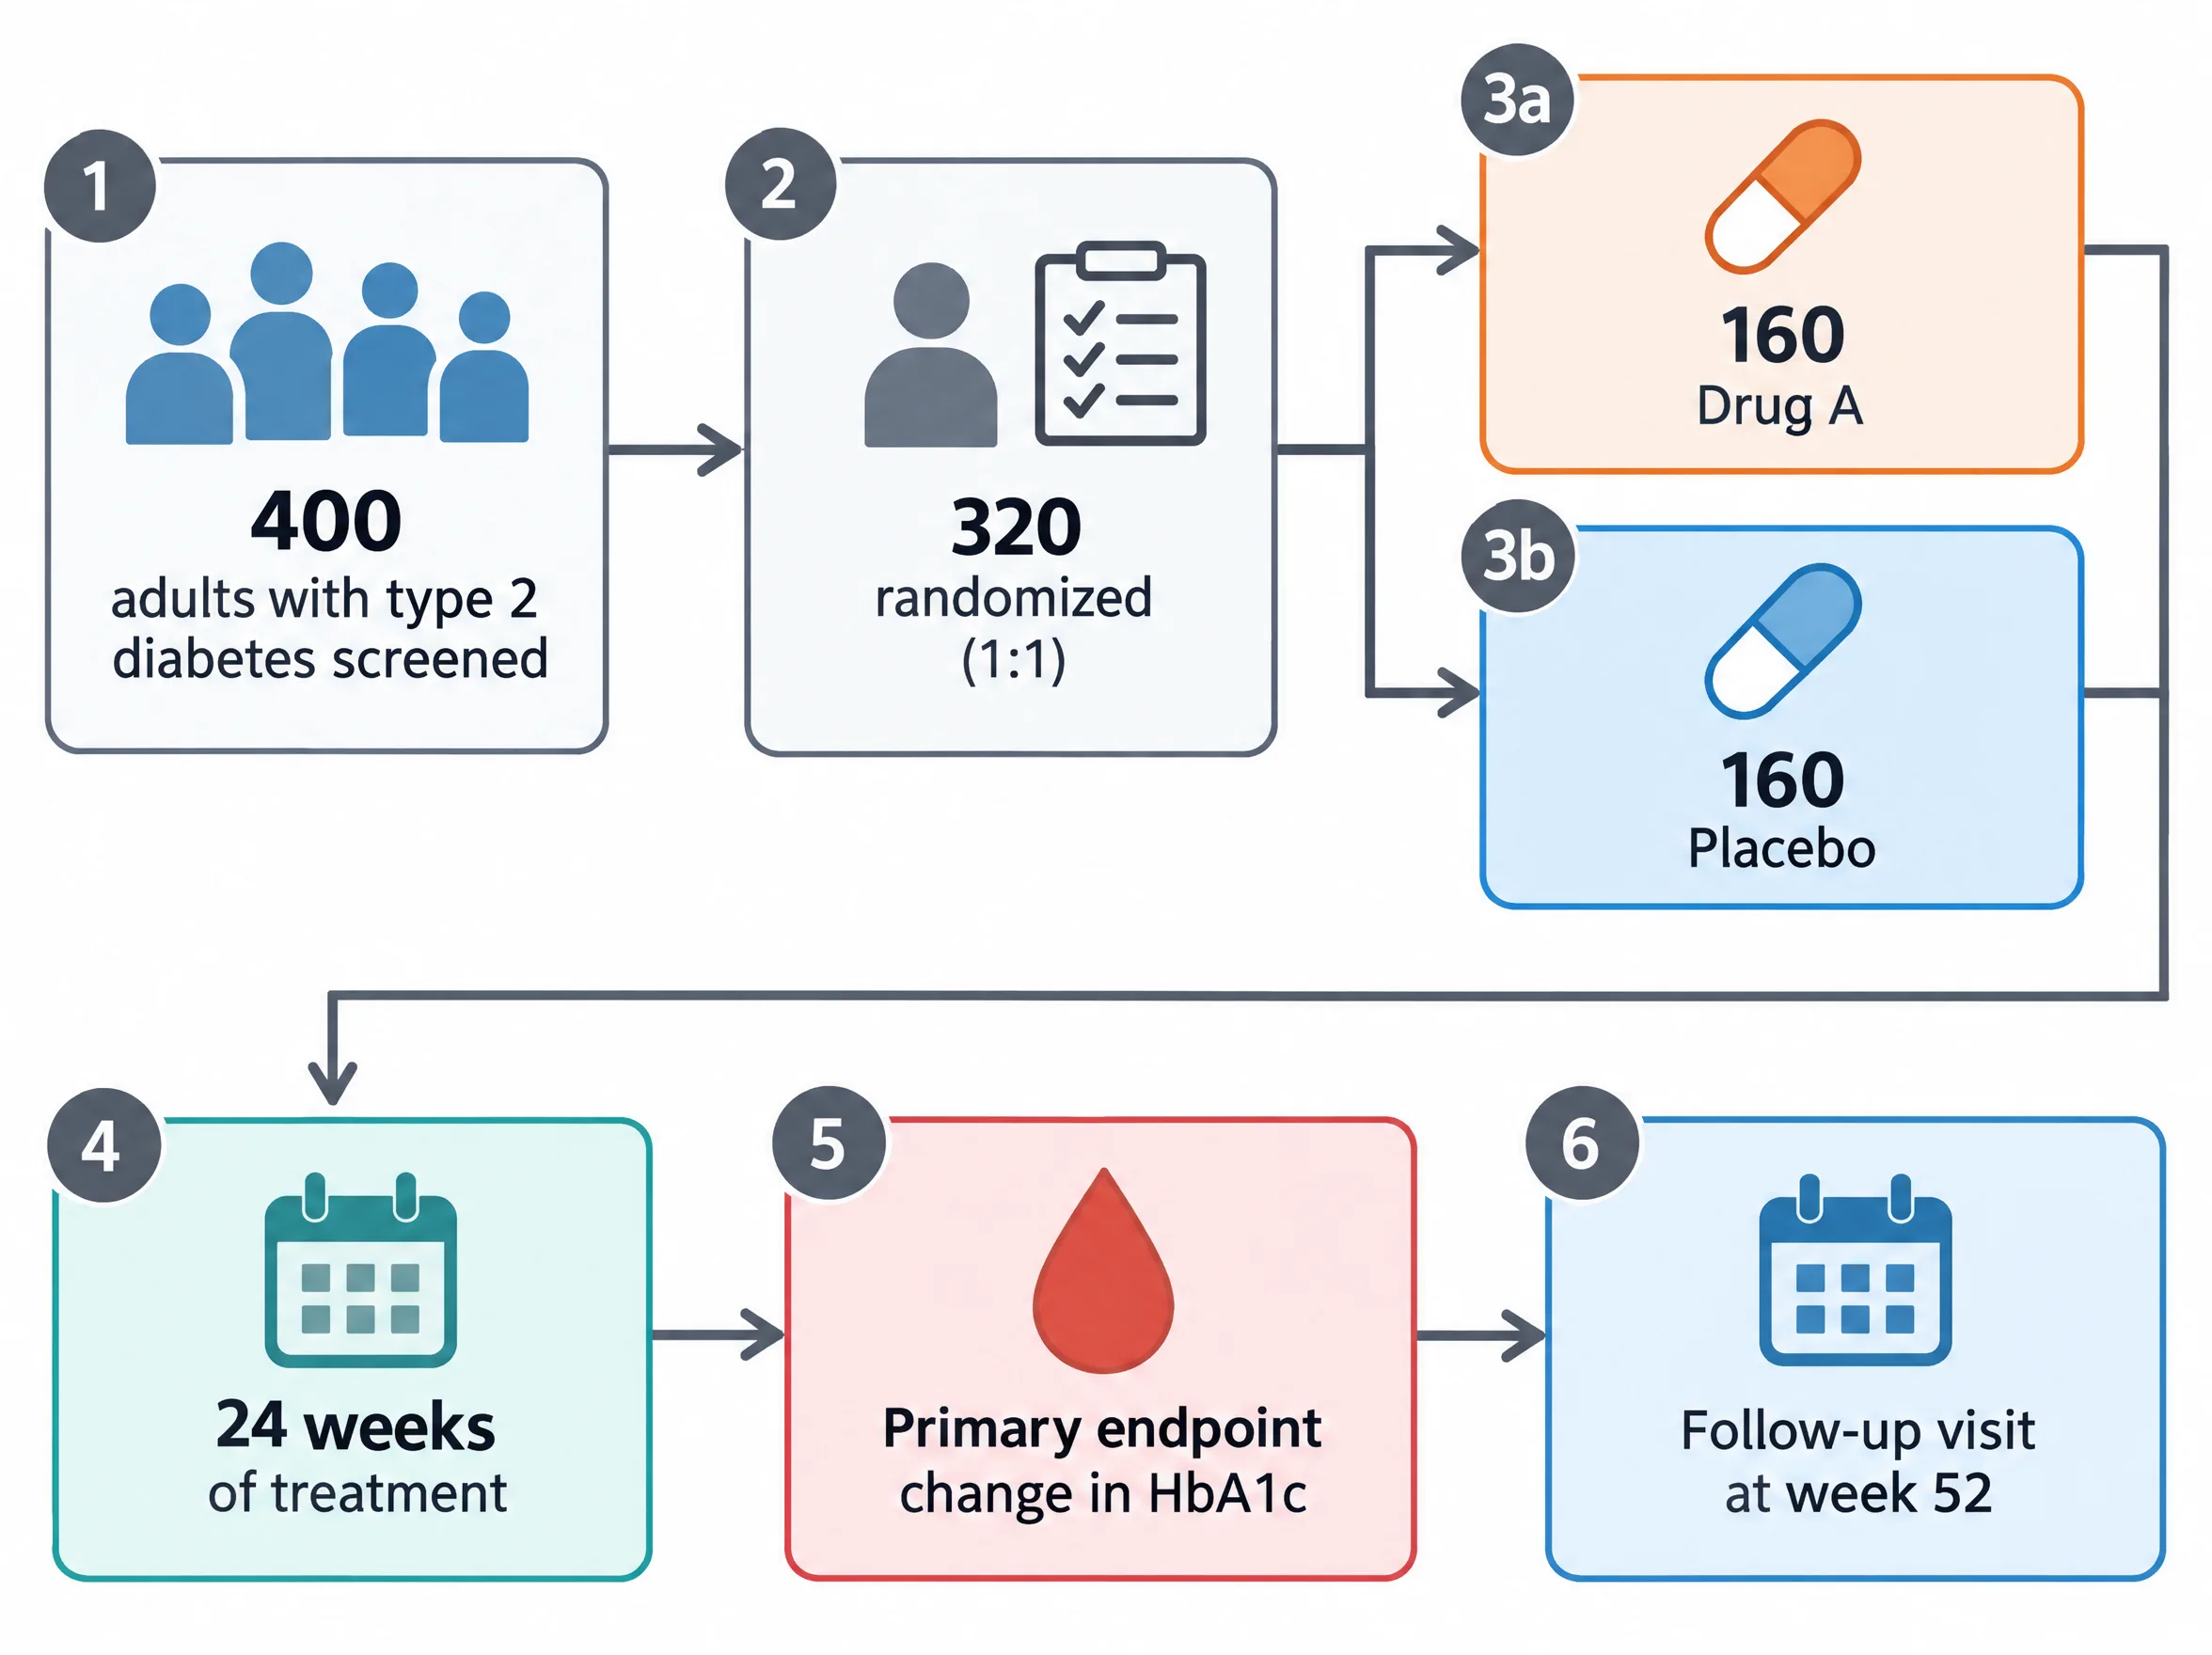
Clinical research · Workflow
“Randomized controlled trial design: 400 adults with type 2 diabetes screened, 320 randomized 1:1 to Drug A or placebo, 24 weeks of treatment, primary endpoint change in HbA1c, follow-up visit at week 52. Show the numbers in each box.”
- E
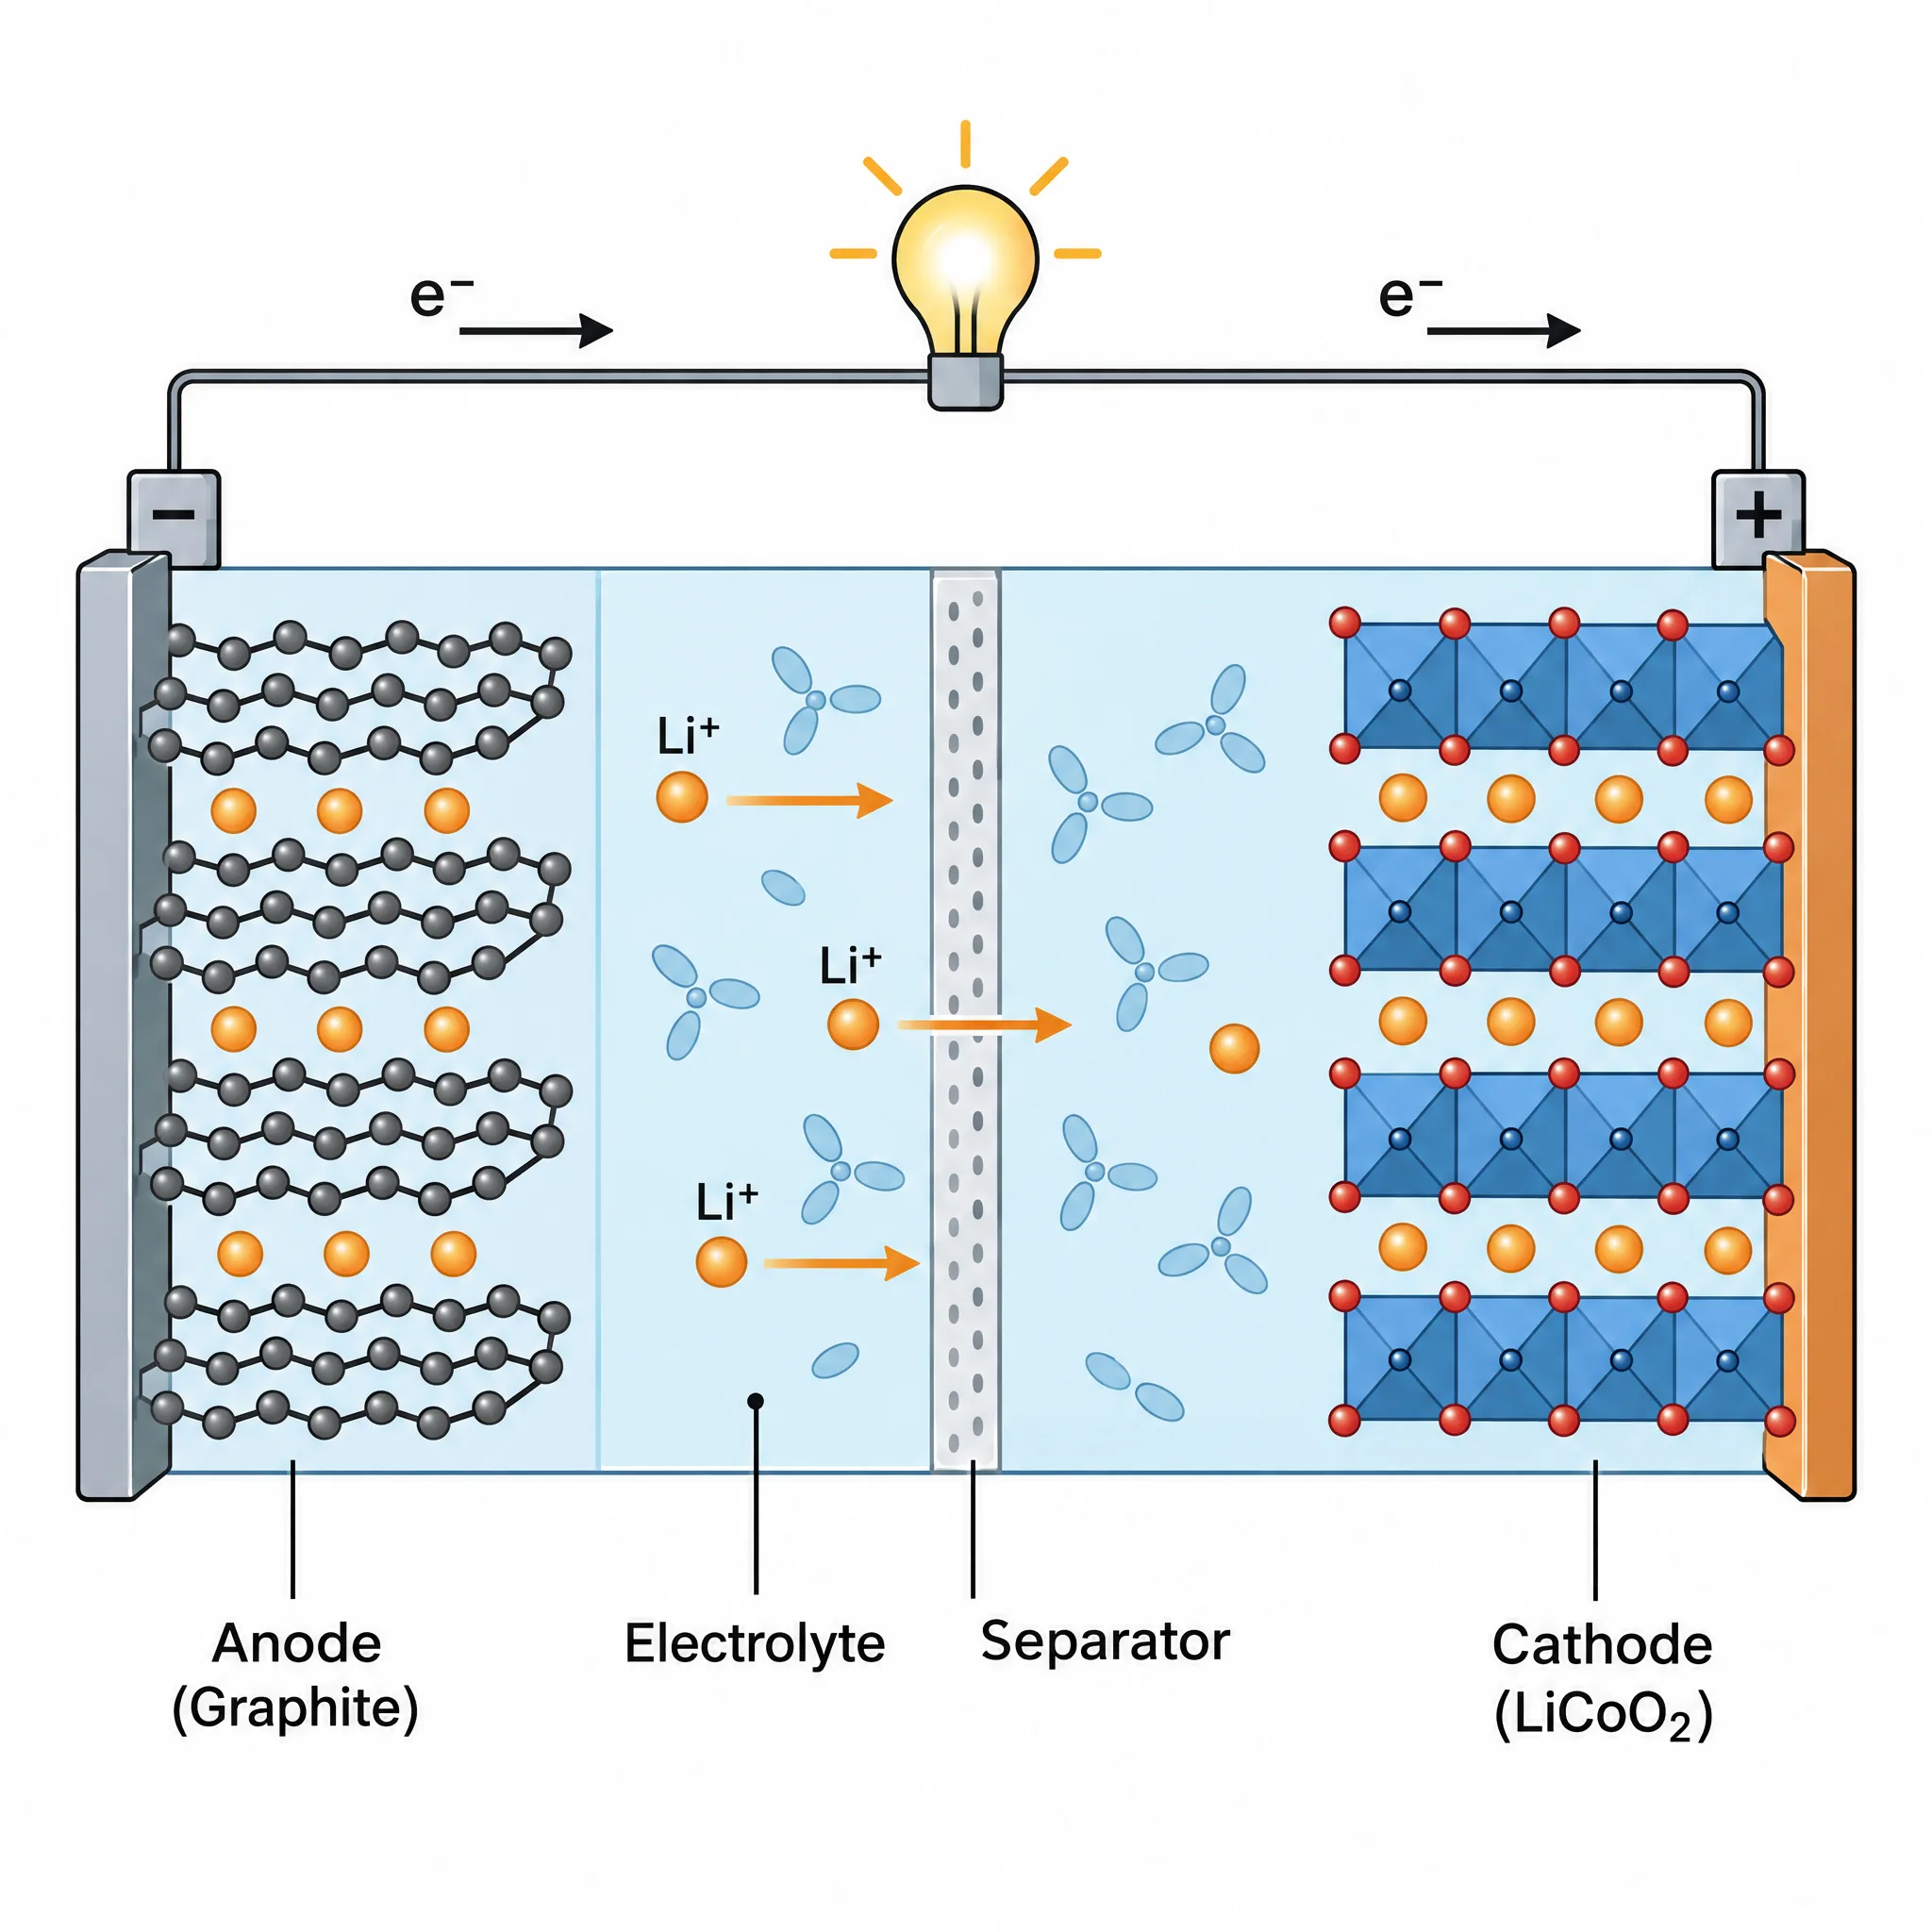
Materials and energy · Illustration
“Lithium-ion battery during discharge: graphite anode on the left, LiCoO2 cathode on the right, separator and liquid electrolyte in the middle, lithium ions moving from anode to cathode, electrons flowing through the external circuit to a light bulb. Label Anode, Cathode, Separator, Electrolyte, Li+, e-.”
- F
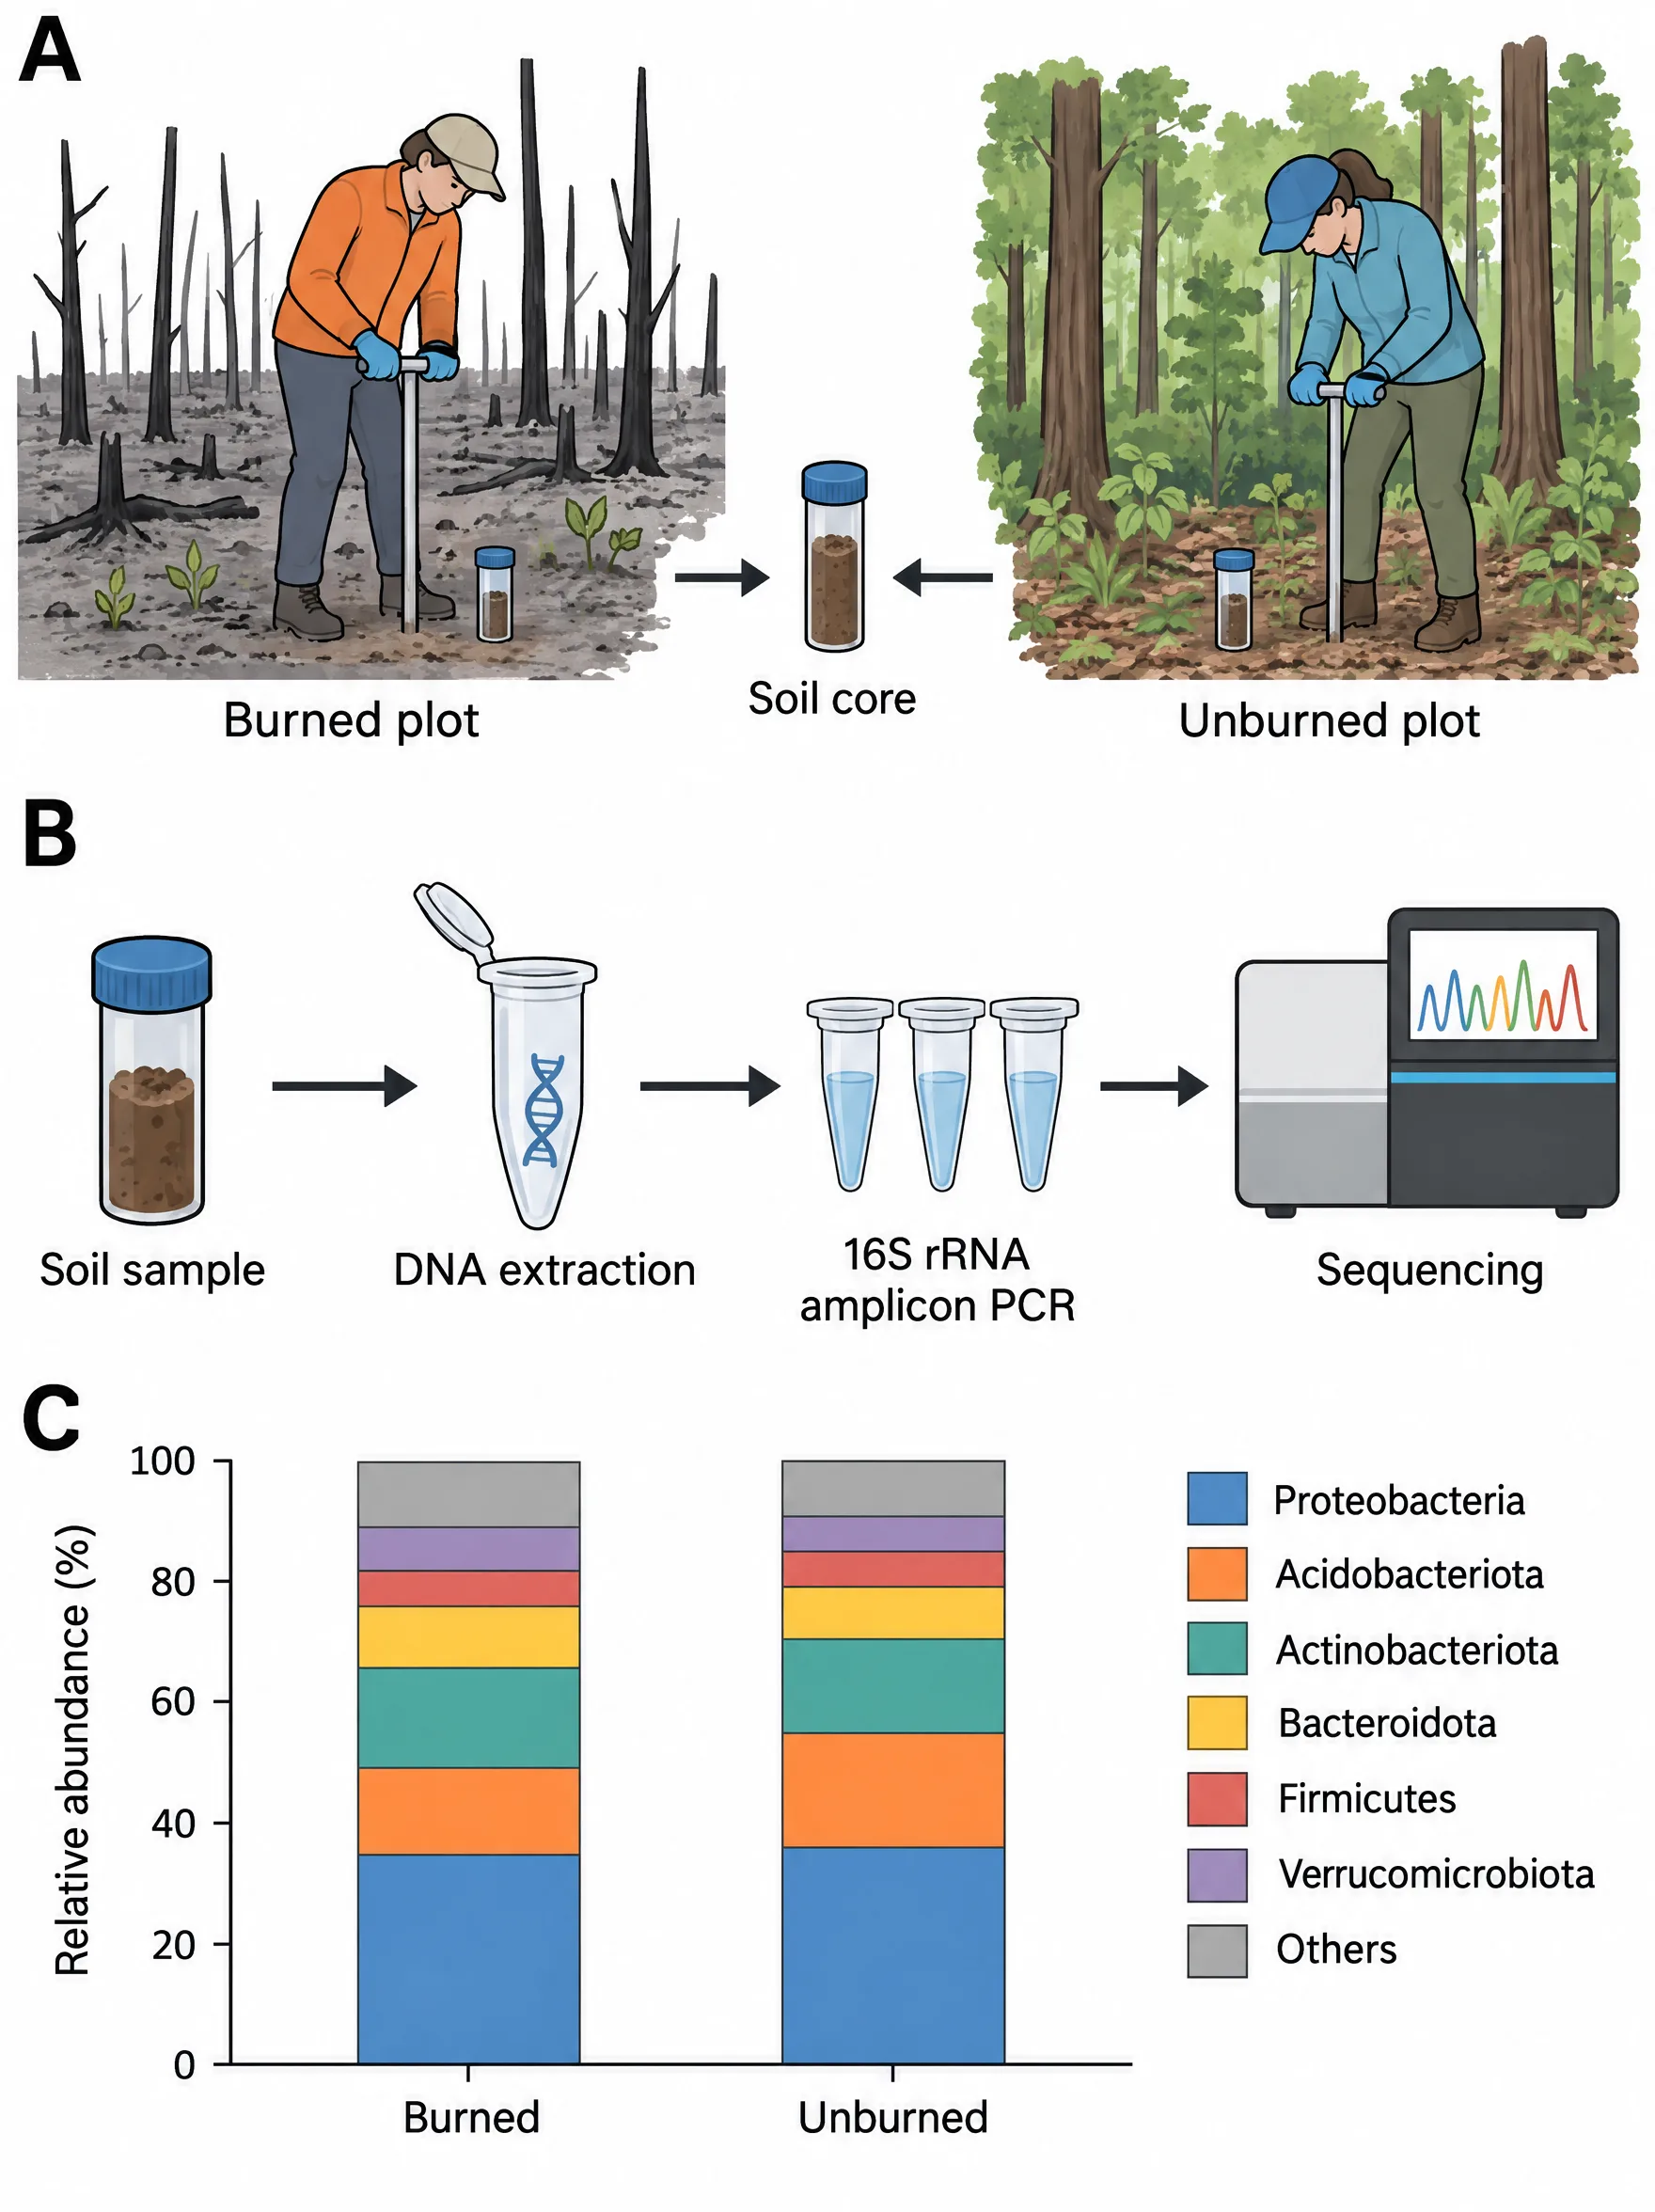
Ecology · Poster panel
“Methods panel for an ecology poster. A: collecting soil cores in burned and unburned forest plots. B: DNA extraction and 16S rRNA amplicon sequencing. C: stacked bar chart of bacterial phyla, burned versus unburned, with a color legend.”
Anatomy of a figure
How to make a good scientific figure: say what each part shows
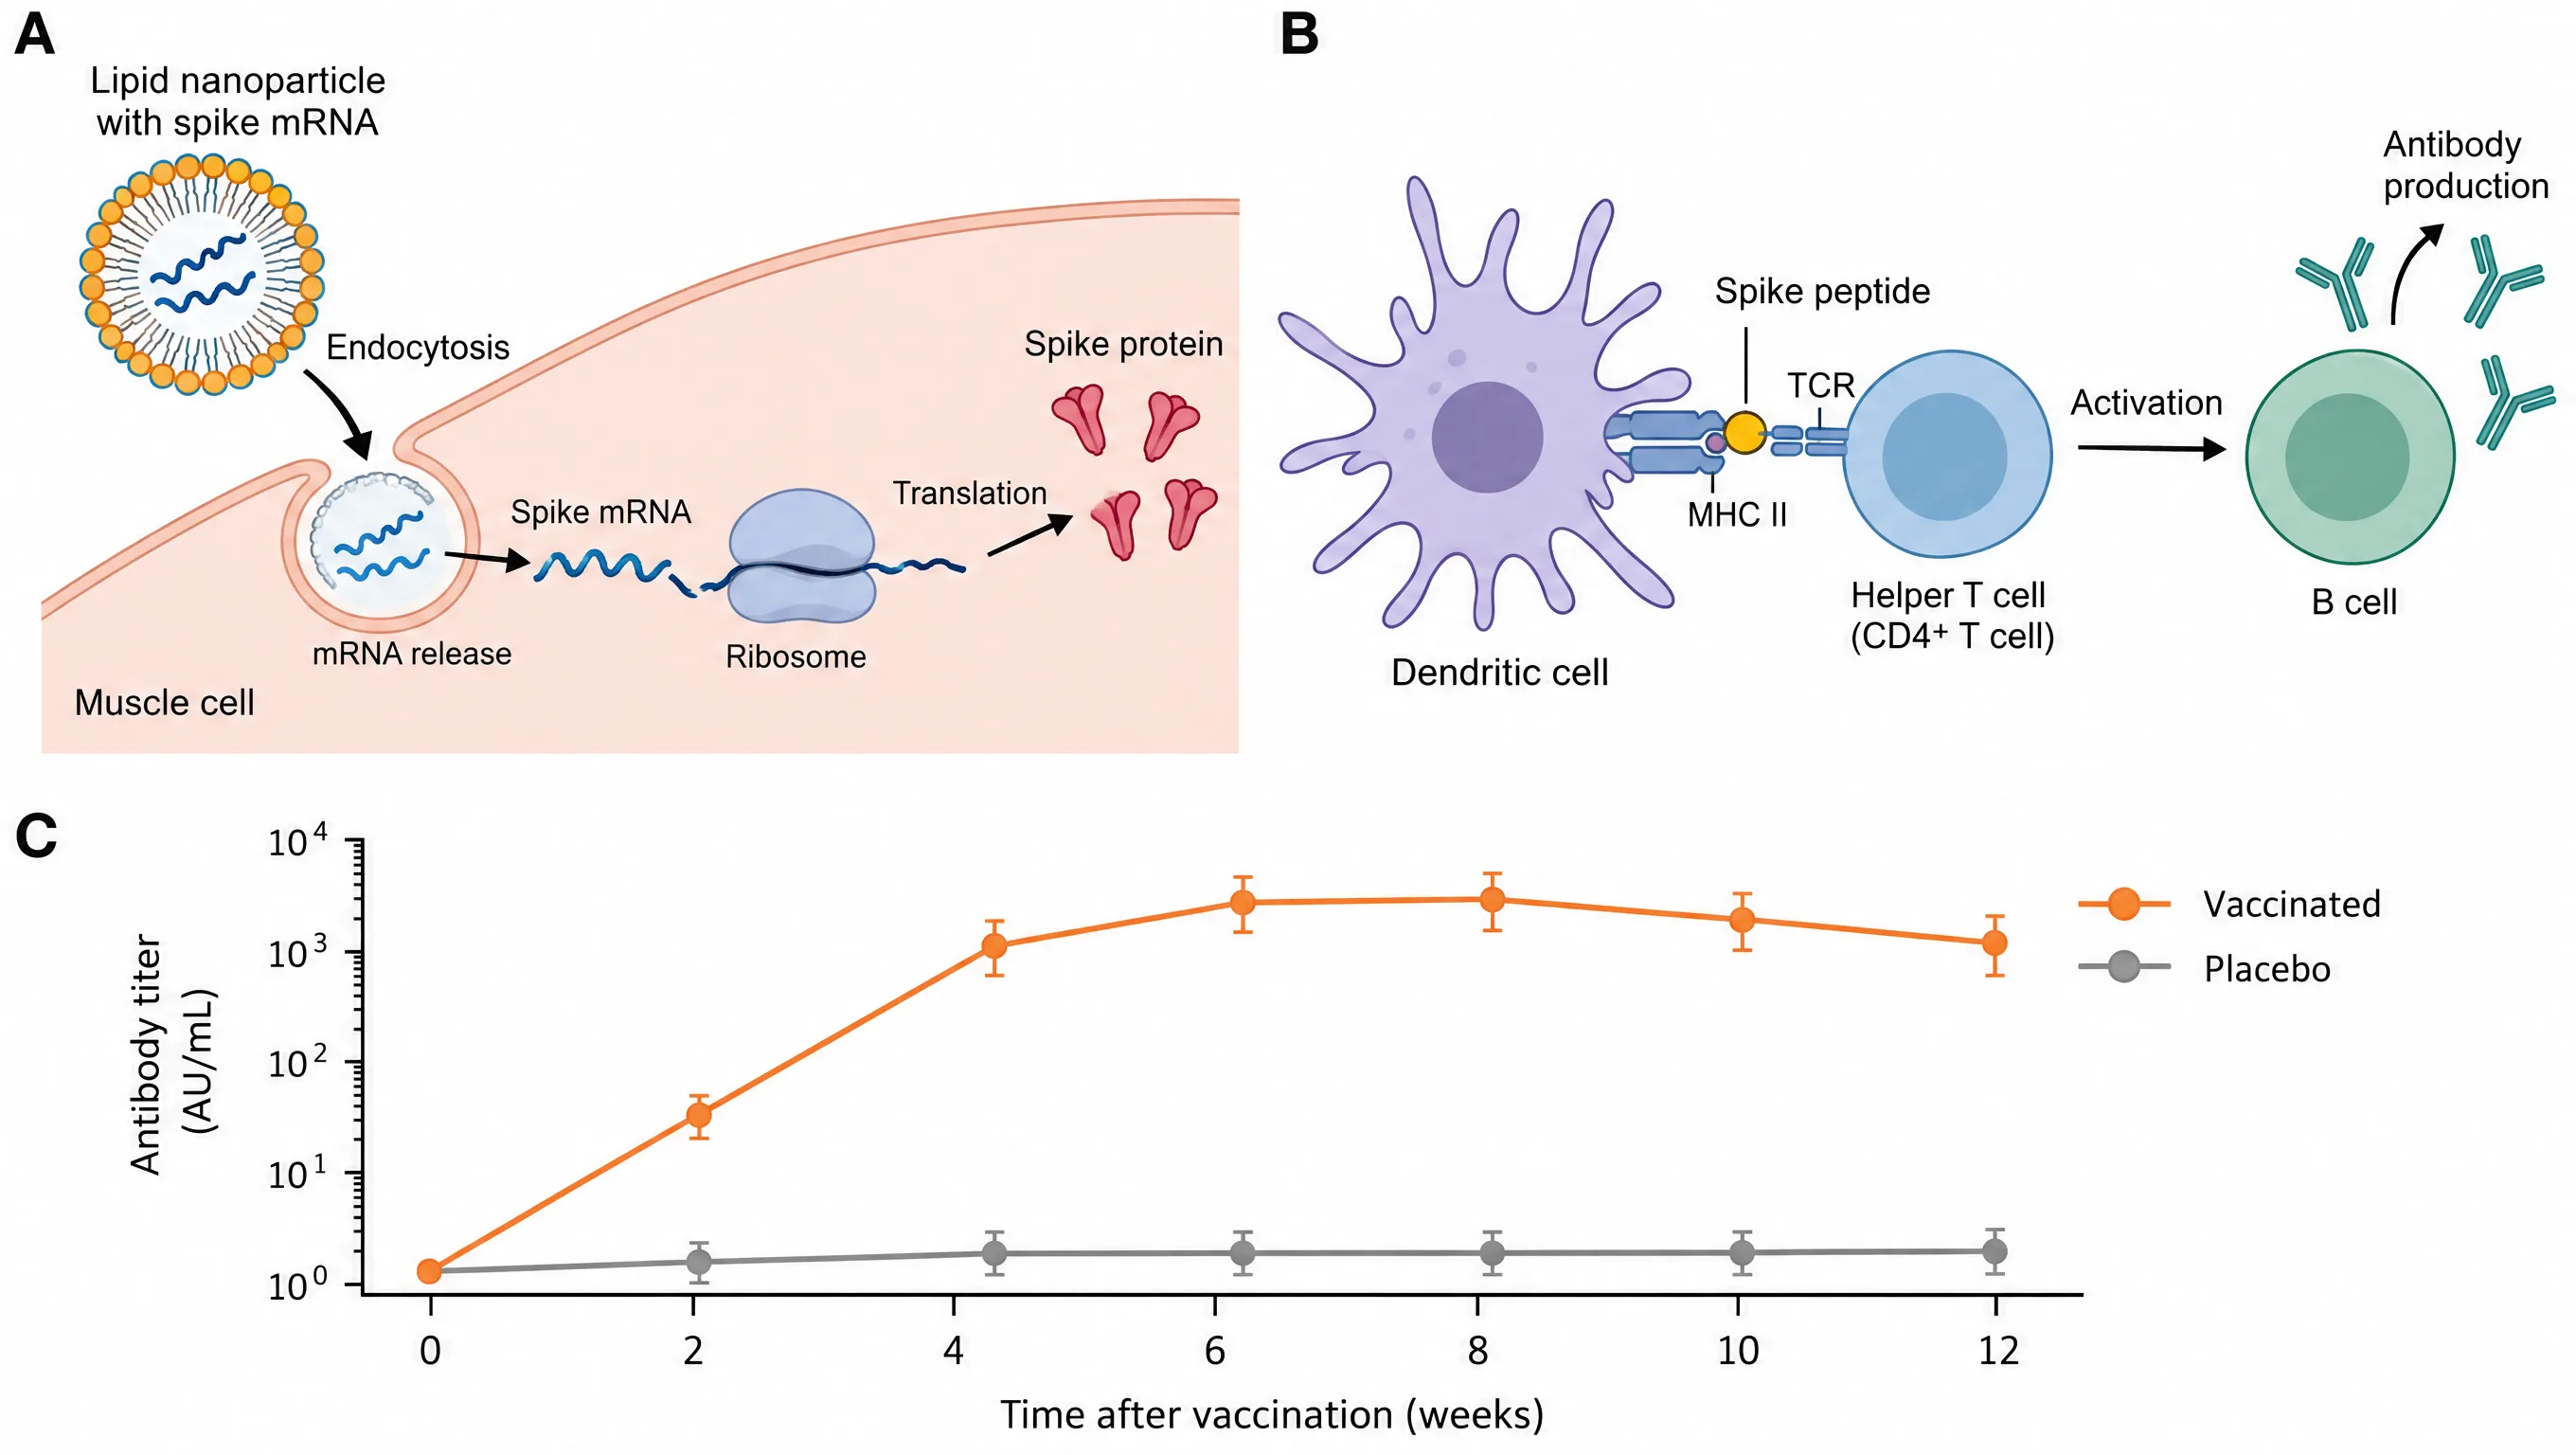
A strong figure has panel letters, short labels, arrows that carry the verbs, a legend and labelled axes. Point at a number to see which words the AI scientific figure generator turned into that part.
From a sketch
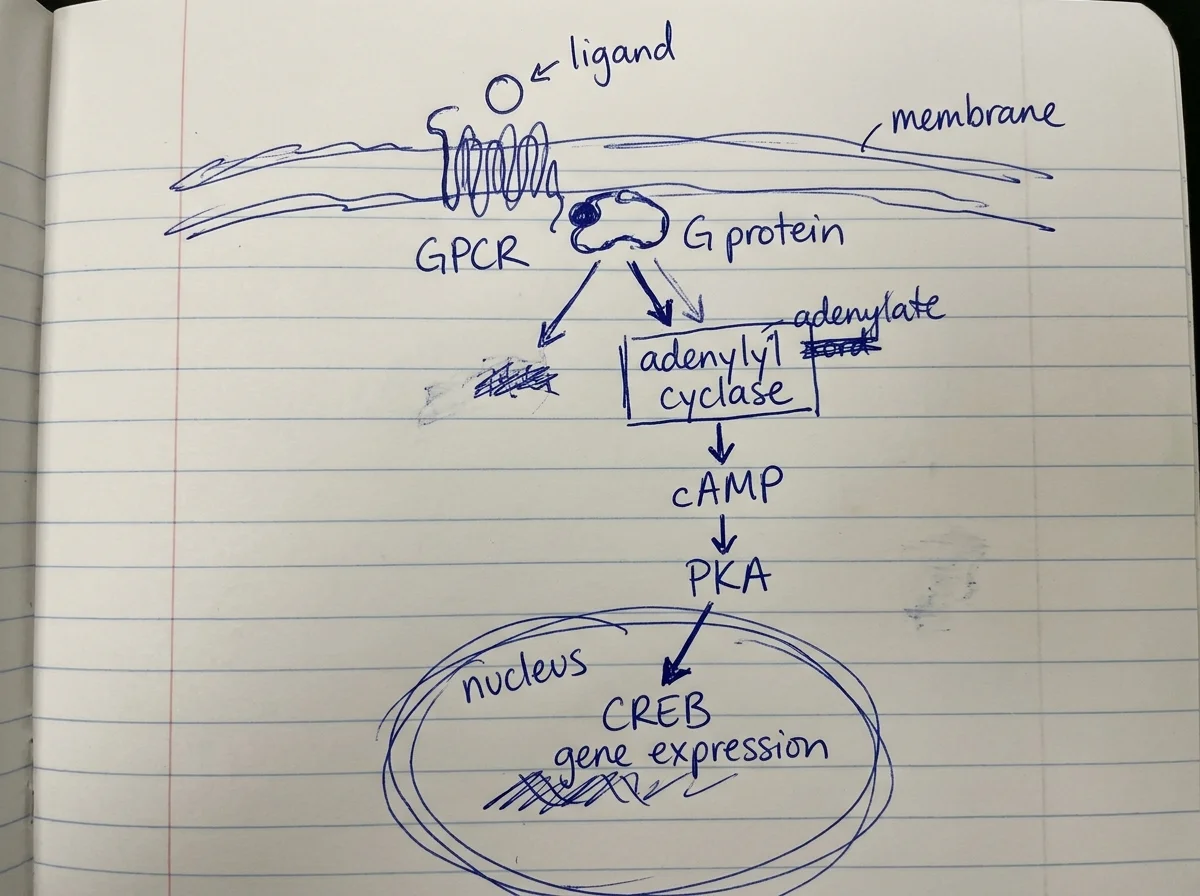
Turn a hand sketch into a clean scientific diagram
Photograph the pathway you drew in your lab notebook, upload it and add one line about what it shows. The AI scientific figure generator keeps your layout, fixes the crossed-out words and redraws every shape. Drag the handle to compare.
 Notebook sketchGenerated figure
From an abstract
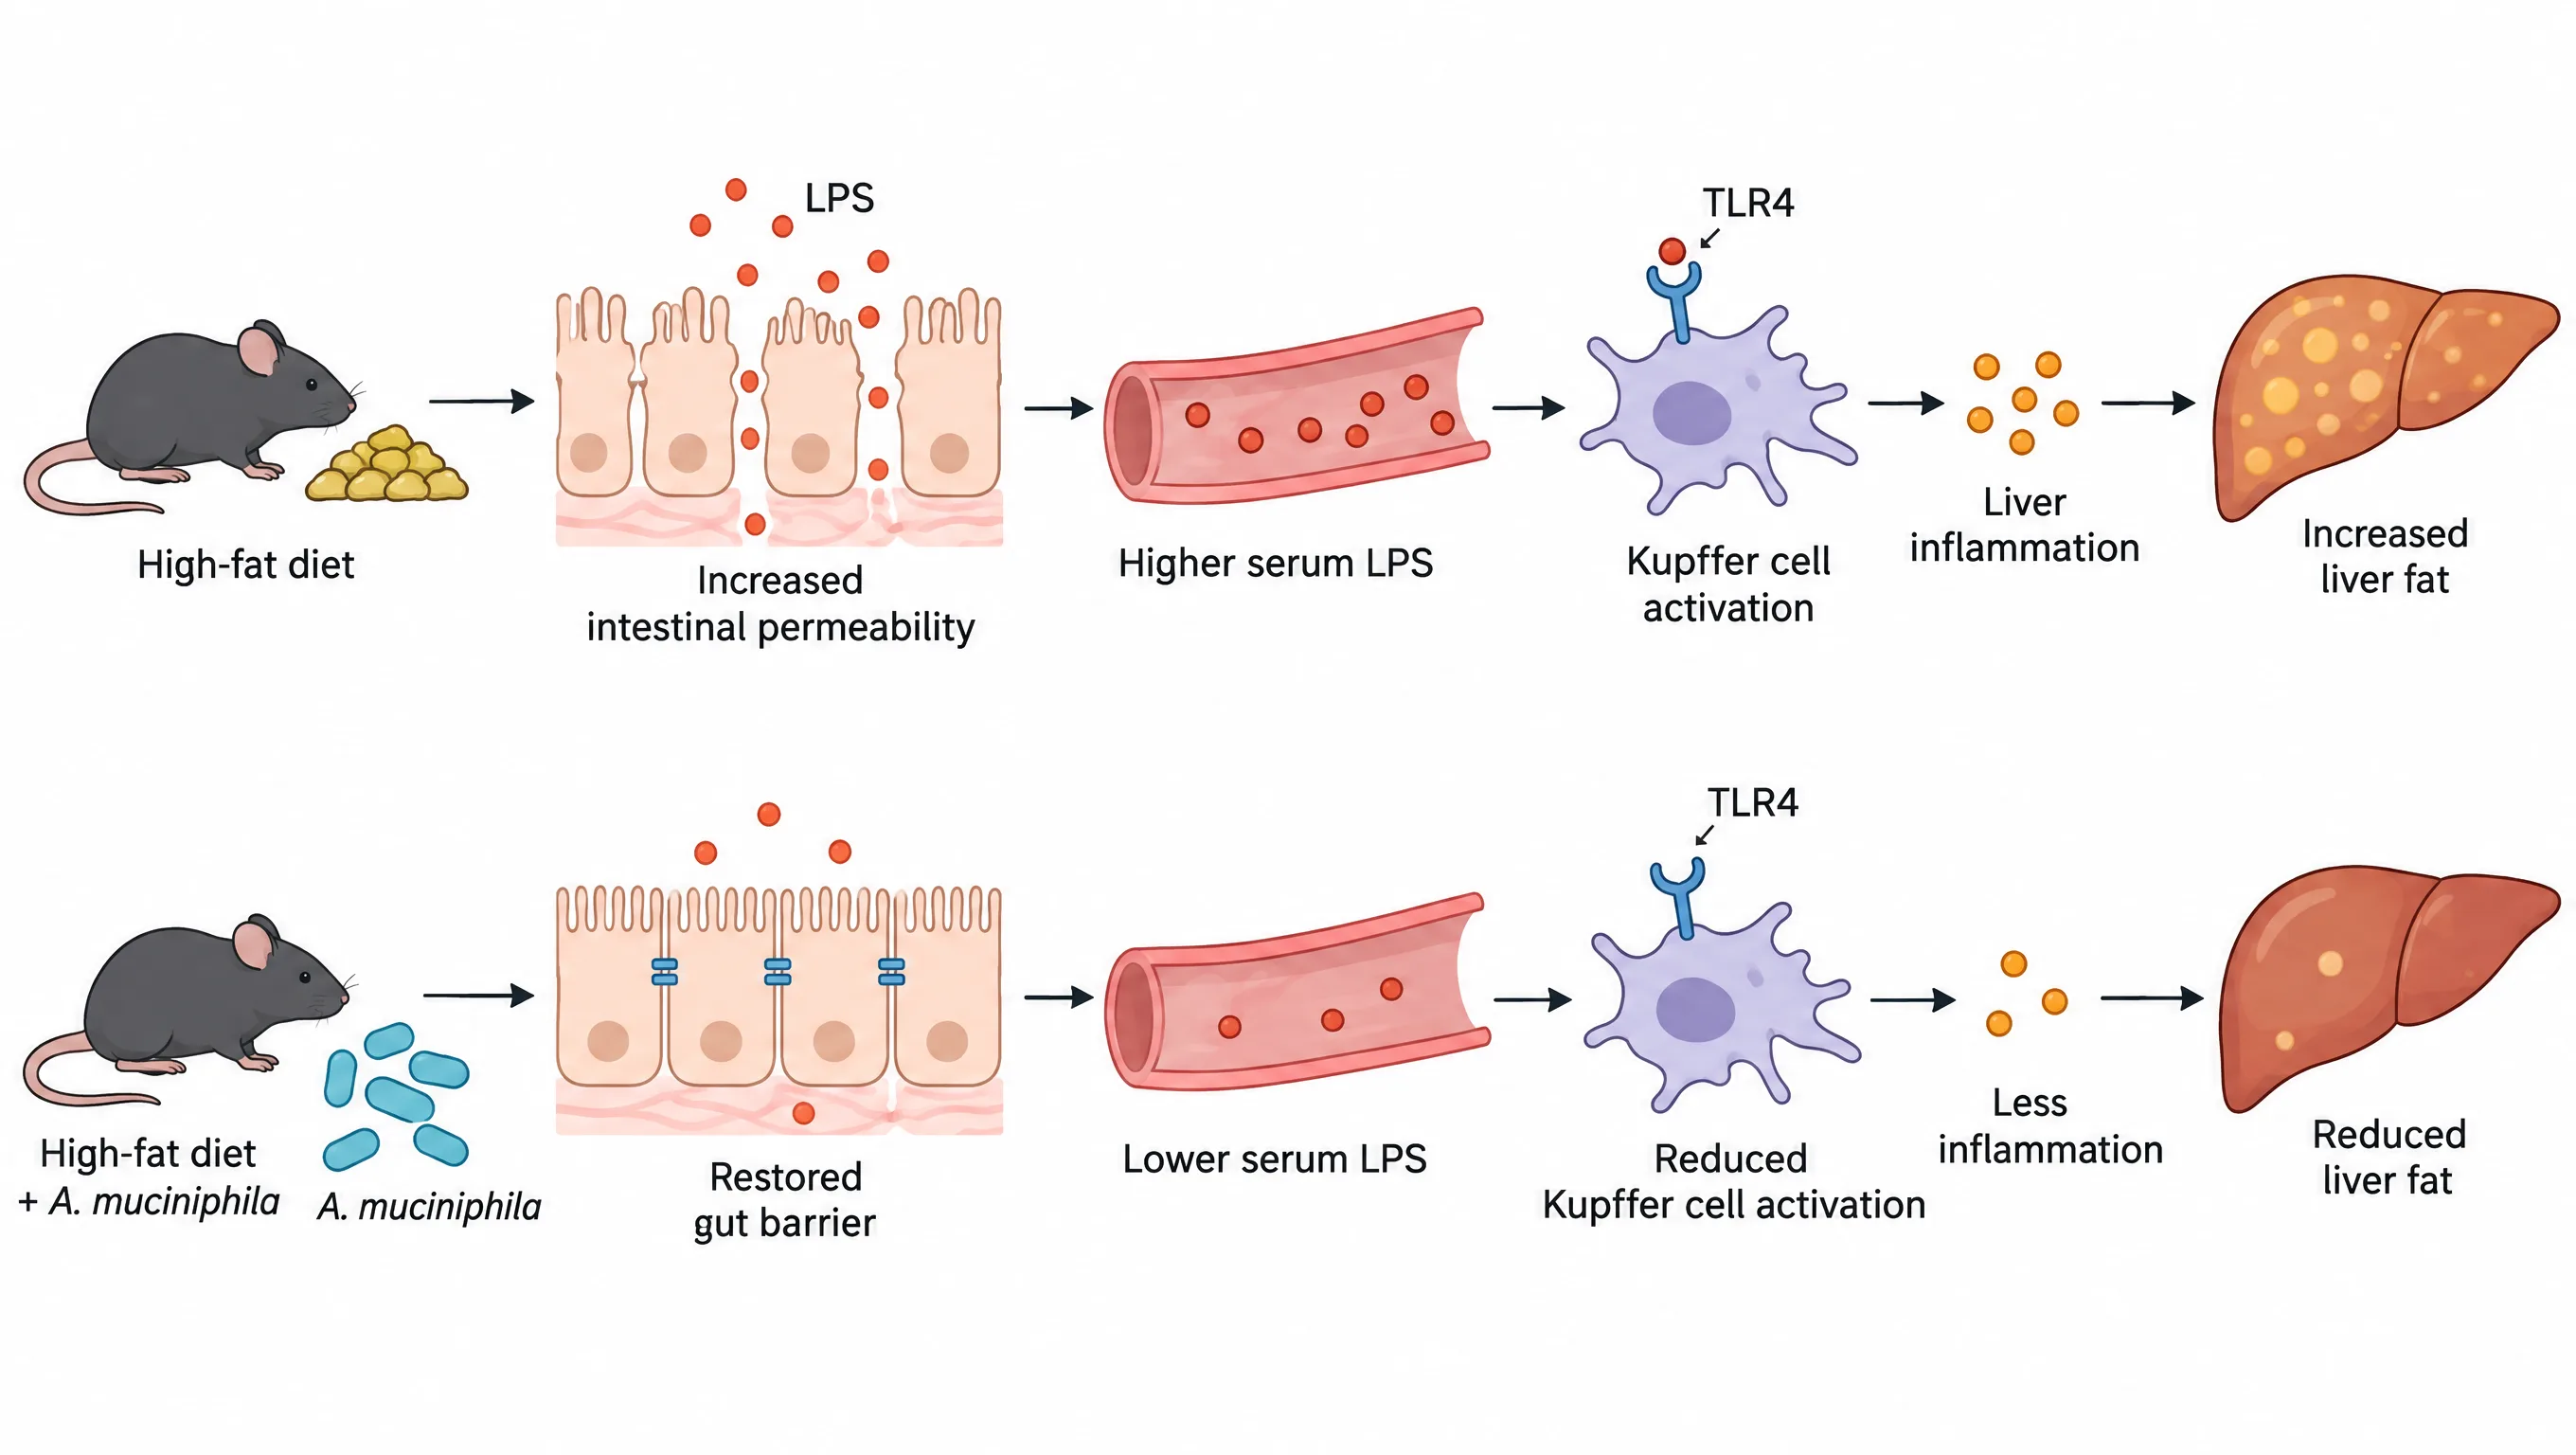
Paste your abstract, get a graphical abstract
Cause, mechanism and outcome in one panel
Choose "Graphical abstract" in the AI scientific figure generator, paste the abstract of your paper and it picks the cause, the mechanism and the outcome, then lays them out left to right in one wide panel. This one came from a four-sentence abstract about diet, gut barrier and liver inflammation.
- Pulls out entities and relationships, never whole sentences
- 16:9 or 4:3 to match the size your journal asks for
- Change one line of the abstract and draw it again
Publication-ready
Sized for the journal page, the poster and the slide
Every figure from the AI scientific figure generator arrives as a 2K PNG on a white background, sharp at the widths journals print. Drop it into your manuscript, your poster template or a slide without resizing.
- Pixels for a 4:3 figure
- 2352 × 1760Pixels for a 4:3 figure
- At full double-column width (183 mm)
- 300 DPIAt full double-column width (183 mm)
- At single-column width (89 mm)
- 600 DPIAt single-column width (89 mm)
- White background, no watermark
- PNGWhite background, no watermark
Journal rules on AI images differ. Read your target journal’s author guidelines before you submit; the FAQ below explains the usual cases.
Results
How it works
How to make a scientific figure with AI in four steps
The AI scientific figure generator needs one description. The figure type, layout and sketch are optional.
- 1
Describe the figure
Write what it shows: the cells or molecules, what acts on what, and the labels you need. A pasted abstract works too.
- 2
Pick the type and layout
Mechanism, graphical abstract, workflow, poster panel or illustration, in 4:3, 16:9, 1:1 or 3:4.
- 3
Add a sketch if you have one
Upload a notebook sketch, a whiteboard photo or an older figure, and the layout follows it.
- 4
Download the 2K PNG
The figure is ready in under two minutes. Change a line of the description to draw a new version.
Compared
AI scientific figure maker vs drawing by hand or with icon libraries
Vector editors and icon libraries give you full control over every shape. The AI scientific figure generator gives you a finished first figure from one description.
| Feature | AI Scientific Figure | Vector editor (Illustrator, Inkscape) | Icon library (BioRender and similar) |
|---|---|---|---|
| You start from | A sentence, a sketch or an abstract | A blank canvas | Templates and a fixed icon set |
| Drawing skill needed | None | A lot | Layout and arranging |
| Time to a first figure | Under two minutes | Hours | Placing icons one by one |
| Drawn for your exact study | From your own description | Anything you can draw | Within the icons on offer |
| Moving one shape by hand | Edit the description and redraw | Full control | Full control |
Pricing
AI scientific figure generator pricing
Start free. One credit draws one 2K figure; packs never expire and subscriptions roll unused figures over.
Pay once, no subscription
Or subscribe and save
FAQ
AI scientific figure generator FAQ
The best AI for scientific figures spells every label right, draws in the flat style journals use and follows your description closely. This generator runs GPT Image 2.5, the strongest model we tested for labelled scientific diagrams, with Nano Banana 2.1 as a backup, and wraps your description in instructions for journal layout, colorblind-safe colors and print-size text.
Yes. The AI scientific figure generator gives every new account free figures at full 2K quality with no watermark, so you can judge the results on your own topic. After that, credit packs never expire and subscriptions start at the Researcher plan.
Journal rules differ. Some publishers, including the Nature portfolio, do not accept AI-generated images in research papers, while others accept them with a disclosure in the methods or acknowledgements. Check your journal’s author guidelines first. Posters, slides, theses, grant proposals, lectures and preprints are open to AI figures.
You do. You can use your figures in papers, posters, slides, teaching material and commercial work, and we claim no rights over them. See the terms of service for the full wording.
Your descriptions, uploads and figures are private to your account and used only to draw your figure. We never use them to train models. Reference uploads are deleted after 3 days, figures after 30 days unless you keep a subscription, and you can delete any of them yourself at any time.
Change the description and generate again to move, add or rename parts. The PNG has a white background, so it opens in PowerPoint, Illustrator, Inkscape or Affinity for cropping, extra arrows or text. An editable vector (SVG) export is not available yet.
A 2K PNG: 2352 × 1760 pixels at 4:3, 2720 × 1536 at 16:9, 2048 × 2048 at 1:1 and 1760 × 2352 at 3:4. A 4:3 figure prints at 300 DPI across a full double-column width (183 mm).
No. Charts inside a generated figure are drawings that show the idea, not your measurements. Plot real data in GraphPad Prism, R, Python or Excel, and use the AI scientific figure generator for the schematic parts: mechanisms, workflows, setups and graphical abstracts.
Name each entity you want drawn, use verbs for what acts on what (binds, activates, inhibits, moves to), list the labels, and say how the figure should read: left to right, top to bottom, or as panels A, B and C. See the anatomy of a figure above for a worked example.
Your next figure is one description away
Describe a mechanism, paste an abstract or upload a sketch. The AI scientific figure generator has free figures waiting in your new account.